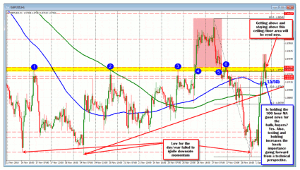
Greg Michalowski, of ForexLive.com, charts this currency pair that trended higher Monday and only experienced a modest correction, but he also highlights the area the pair needs to get—and stay above—for the price to continue to march higher.
The GBP/USD extended the trading day’s highs to 1.5762 on Monday, before better-than-expected ISM knocked the pair back down.
The corrective move lower took the price down to the 1.5720 level (61.8% of the move up from the 2013 low to the 2014 high) and the 100-hour MA (blue line in the chart below) at the 1.57145 level. The low, on the correction, came in at 1.57135, just below that 100-hour MA but close enough to call it a successful test and hold.
Is this good news for the bulls/buyers? Sure. The pair has trended higher Monday. The pair’s correction was modest. The pair found support buyers against some expected levels (61.8% and 100-hour MA).
So advantage remains with the buyers. What the corrective bounce also does is solidifies the level(s) as a risk-defining area. Stay above the 1.51714-20, and all is well. Move below and expect some further corrective pressure.

GBP/USD holds above the 100-hour MA
Click to
Enlarge
Is it full steam ahead? The buyers/longs would hope so. However, the pair still needs to get and stay above what is a ceiling/floor over the last few weeks of trading. Looking at the hourly chart, there are a number of hourly bars which either held resistance or provided support in the 1.57347-1.57398 area (see blue circles). If the price is to continue to the march higher, getting and staying above this area will be needed. Earlier Monday, the first look above this area had only one closing hourly bar above the level. So there is more to prove.
By Greg Michalowski of ForexLive.com


