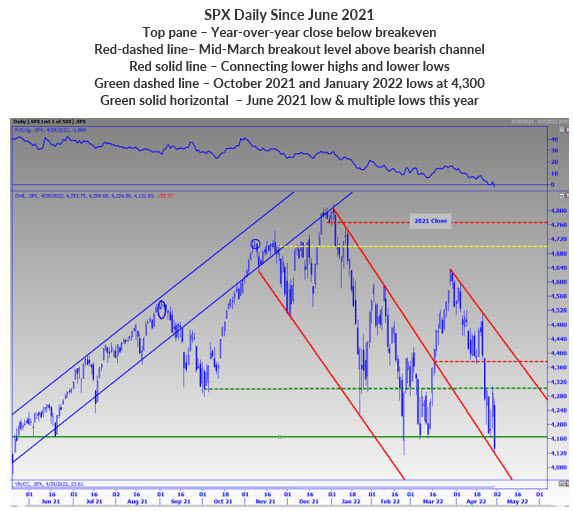
History has shown that vicious rallies do occur in the context of bear markets and, as such, the mid-March breakout above a trendline connecting lower highs has an uncertainty to its sustainability, explains Todd Salamone, senior V.P. of research at Schaeffer's Investment Research.
Admittedly, the SPX has not officially entered a bear market. But the fact that the SPX hasn’t achieved a new high in months, in addition to the Fed pivoting to a more hawkish strategy, and the SPX’s break below a long-term channel, has certainly increased the possibility of a prolonged period of lower stock prices, as investors adjust to higher interest rates, and possibly slower economic growth.
The close below 4,375 was followed by an immediate retest of the February and March lows; but a bounce from this support area failed to materialize into anything substantial. In fact, the SPX closed out April trading in negative territory year-over-year for the first time since May 2020.

Amid the carnage, the Nasdaq-100 Index closed at its 2022 lows and was driven south of the 13,000-millennium mark. Moreover, for the first time since December 2018, it experienced a monthly close below its 24-month moving average, which qualifies this index being in a bear market by our definition. It is also 22% below its November closing high, meeting the consensus definition of bear market.
Short-term sentiment measures and a pickup in VIX put volume indicate we could see more short-term bursts higher, though moves above resistance levels may prove fleeting.
Bulls beware, particularly long-term bulls, that unless the SPX moves back above 4,375 in the weeks ahead, rallies may be short lived, perhaps even weaker in magnitude than the bullish action from mid-to-late March. As such, they should be used to lighten up on bullish positions or to hedge long positions, if you haven’t done so already.
Not only does 4,375 represent the level from which the SPX broke out above a channel connecting lower lows and lower highs from January through February, note that a new trendline connecting lower highs from late-March into mid-April has developed.
In mid-May, this trendline will be sitting at 4,375, and at the beginning of June, this trendline will be sitting at 4,300. As such, a move north of 4,375 can only happen if the 4,300-century mark is taken out, which not only proved to be resistance into this week, but could also be a formidable resistance level a month from now if retested again.
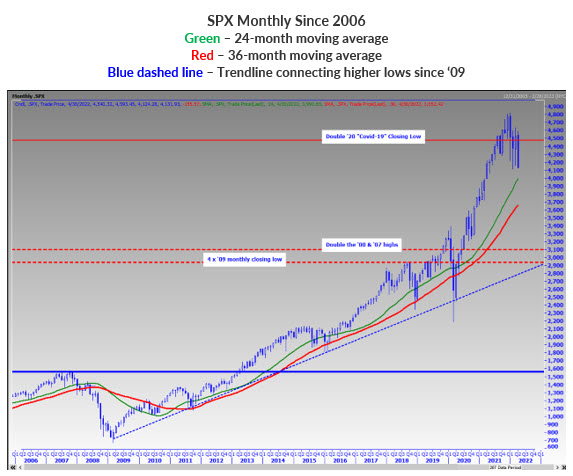
The SPX is well above its 24-month moving average at the 4,000-millennium level. As you can see, this long-term moving average has supported the SPX on multiple occasions.
But you should also note that when the SPX breaks below its 24-month trendline, the 36-month moving average, currently situated at 3,650, has come into play and/or a trendline connecting higher lows since the 2007-2009 bear market trough. I am making these observations so that you can continue to assess risk-reward in the coming weeks.


