
The most widely watched yield spread, the difference between the 10- and 2-year yield, has inverted. That means the 2-year yield is now higher than the 10-year yield (which is not typically the case), observes Rocky White, technical expert with Schaeffer's Investment Research.
This phenomenon has been a well-known predictor of recessions. Recessions, however, are usually identified after the fact and they do not correlate perfectly with the stock market. Also, a yield spread inversion between the 10-year yield and 3-month yield has been a better predictor of recessions than the more popular 10- and 2-year inversion.
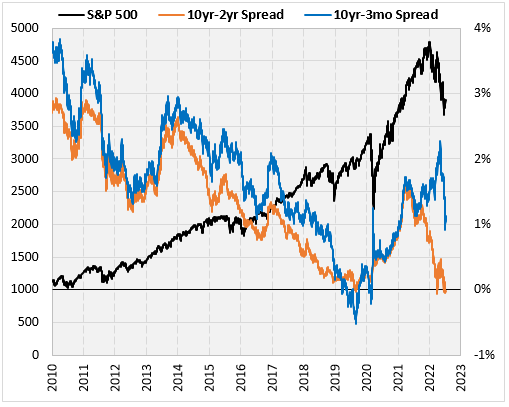
The chart below shows the S&P 500 Index (SPX) along with the 10- and 2-year yield spread (I’ll call it the 10yr-2yr spread from here on out) and the 10-year and 3-month yield spread (10yr-3mo spread).
The 10yr-3mo spread is still around 1% (or 100 basis points) and may take some time before it inverts, if it even does invert. Here, I’m looking at how this indicator has worked for the stock market and if one spread merits more attention than the other.
For this analysis, I went back to 1989, which is when our database has daily data for the relevant yields. Then I found dates where the yield spread turned negative for the first time in at least ten trading days. Before I compare the results for the different yield spreads, the table below shows typical S&P 500 returns since 1989.
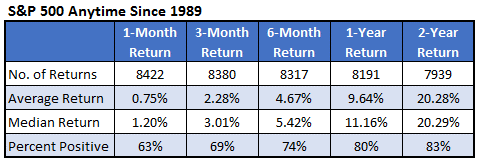
Recall, a yield spread inversion is supposed to be a bearish signal and the tables below confirms this. The returns in the tables below easily underperform the returns in the table above.
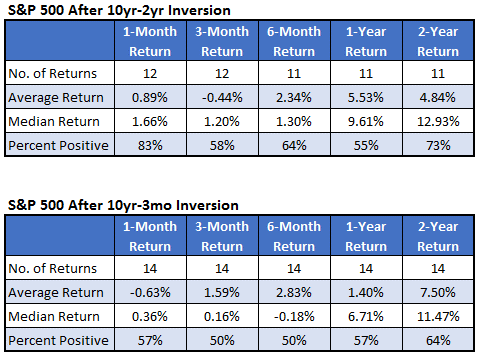
The first table shows how the S&P 500 performed after an inversion of the more popular 10yr-2yr yield spread. The second table shows the numbers after an inversion of the 10yr-3mo yield spread. Looking at the average return, it depends on the time frame to determine which spread is a better predictor of bearishness.
Considering the median return and percent positive, I conclude that the 10yr-3mo spread is a more reliable bearish indicator. The median is lower at every time frame for the 10yr-3mo spread.
Focusing on stock returns one year after an inversion, the S&P 500 averaged a 5.5% return after the 10yr-2yr inversion. That is bearish compared to the typical returns shown in the table above. The market has been worse, however, in the year after a 10yr-3mo spread inversion. In that case, it has averaged a gain of just 1.4%.
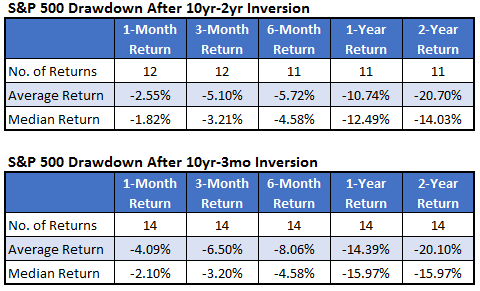
Since these inversions are specifically used to predict downturns, I looked at this in more than one way. Instead of looking at returns at each time frame, I looked at the drawdown from the inversion date to each time frame. In other words, what is the biggest loss one can expect over the next month, three months, six months, etc. This gives a better understanding of what the risk is after an inversion.
Looking at the tables below, once again, the SPX slightly underperforms after an inversion of the 10yr-3mo spread when compared to the 10yr-2yr spread. In the next year following an inversion of the more popular 10yr-2yr spread, the S&P 500 had an average drawdown of 10.7%. After an inversion of the 10yr-3mo spread, the average drawdown was 14.4%.
This last table shows typical drawdowns since 1989 for the S&P 500. To make the point that an inversion is a bearish signal, the median one-year drawdown in the table below tells us at any point in time, there has been a 50% chance of the market falling 4.6% at some time in the next year.
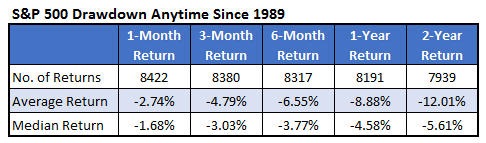
After an inversion of the 10yr-2yr yield spread, like we’ve seen recently, there was a 50% chance of a 12.5% loss at some point over the next year. If we see an inversion of the 10yr-3mo spread, it was a 50% chance of a 16% loss over the next year.


