
In this review, I’m looking at the impact midterm elections have on stocks; I’m curious about how stocks tend to behave leading up to the elections and thereafter. Not only performance-wise but volatility-wise too, asserts Rocky White, senior quantitative analyst at Schaeffer's Investment Research.
Looking at the S&P 500 Index returns in the two weeks before Election Day going back to 1950, investors seem enthusiastic whenever there’s an election coming up. Whether it’s a presidential election or a midterm election, the index has performed very well in the preceding couple of weeks.
I was surprised to see volatility muted heading into election day. Off years have higher standard deviation of returns than election years. One theory could be that investors are hopeful about the upcoming elections but waiting for the results before making big moves.
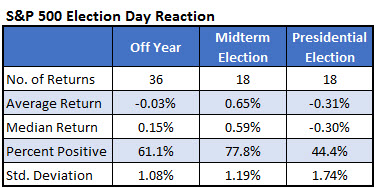
The table below shows how the S&P 500 has performed the day after the election. Results come in on Tuesday night, so these are Wednesday returns during election week. The reaction to midterm elections has been positive, averaging a gain of 0.65% with 78% of the returns positive.
That’s different from the reaction to presidential elections in which the S&P 500 has averaged a loss of 0.31% and just 44% of the returns positive.
During non-election years, the day after what would be election day has averaged a small loss with 61% of returns positive. As expected, the day after elections have a higher standard deviation of returns than the returns in non-election years.
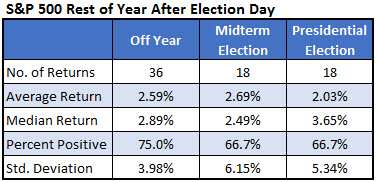
Now let’s look a little longer term. The last couple months of the year have tended to be bullish whether there have been elections or not. During midterm election years, the S&P 500 has averaged a return of 2.69% through the end of the year, with 67% of returns positive.
During non-election years, stocks have also performed well, averaging a gain of 2.59% with 75% of returns positive. There's been a tendency toward more volatility after elections compared to other years, which is not surprising.
Now for the good news. Since 1950, the S&P 500 has been up every time in the six months following midterm elections, meaning 18 positive returns in 18 tries with an average return of 13.89%. Those are impressive six-month return numbers.
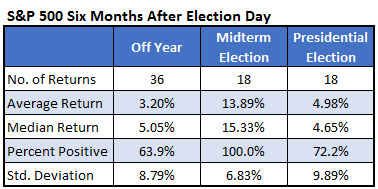
In presidential election years the index averaged a return of about 5% with 72% of the returns positive. In non-election years, the six months after election day (recall, that’s the Tuesday after the first Monday of November) has averaged a return of 3.2% with 64% of returns positive.


