
I find myself spending more and more time focusing on analyzing market structure, looking for the clues price has left right in front of me about its probable path. I still use my all of my normal tools: Median Lines, geometric or Fibonacci expansions and retracements, lines drawn from multiple tops and bottoms, and of course, solid money management and risk control.
But the more I work with other traders trying to help them improve their trading, the more I realize just how much my successful trades rely on correctly reading market structure, identifying changes in the market's behavior, and knowing just where the majority of the market players are massing their buy and sell orders.
Let's look at a recent example in the Canadian dollar on a five-minute bar chart and see if I can show you what I mean:
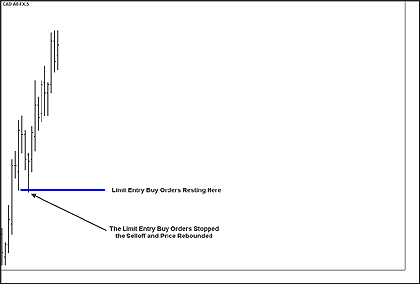
On this first chart, I marked where I think there are limit entry buy orders with a thick blue line. This area is formed by the bottom of a wide range bar higher, and you can see that price pulled back to test this area and immediately found support here. If price comes back to this area, there are a large amount of limit buy orders left by traders that want to get long, but have not been able to get long on a pull back in price because price then rallied hard from this area of support.
How do I know the market orders are where I marked them on this chart? I can tell by price's reaction when it tested the area.

Now note that after price made three new highs—the last two had the same high, so they are called double tops—price made one last high and then plunged lower, easily breaking through the lows of the prior three bars.
This is a sign of weakness, so some traders are now willing to attempt to get short at the prior highs if the market rallies back there. They have left limit entry sell orders that will allow them to short this market at that level.
More tomorrow in part 2.
Timothy Morge
timmorge@gmail.com
www.medianline.com
www.marketgeometry.com


