
You know I’m a big fan of studying price patterns and looking for those patterns to repeat, and it appears that we have a near-identical repetition—on a smaller scale—of the move down and rally from the February low, which has played out over the last few trading days.
Let’s see them and compare.
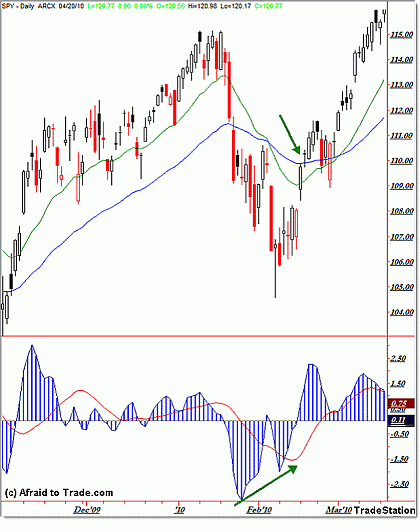
First, the Daily S&P 500 (SPY ETF) chart showing the February 2010 low and recovery:
Click to Enlarge
The most important feature to note is the three-wave swing (“ABC” – A down to $107, B up to $110.50, C down to $105) that formed a positive momentum divergence on the low.
Price then shot straight up through the 20- and 50- EMAs (which were in a bearish posture) and continued up—in “popped stops” mode—to challenge and then exceed the key swing high at $115.00 (1,150 in the S&P 500 Index).
Is that pattern setting up again?
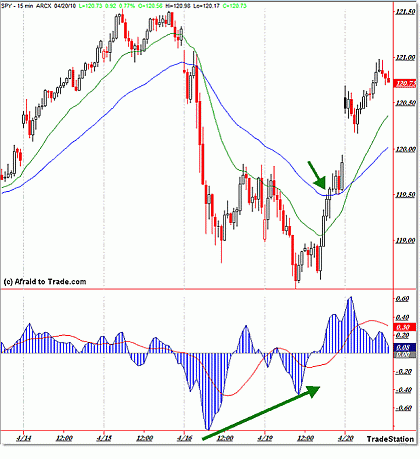
Next, the most recent price action on the intraday charts:
Click to Enlarge
Price followed the script perfectly, breaking down, forming the same “ABC” three-wave move into the April 19 low at noon, then—almost as if on cue—shattered back above the averages this morning with the gap.
Since then, we’ve had a sustained rally, pausing only slightly in the afternoon session.
If bulls can keep driving price higher beyond today’s swing high at $121.00, then we could be in store for a continuation run to the $121.50 area and beyond—in exact pattern repetition.
If not, then the market followed the script, but deviated at the end—which still is interesting.
These sorts of posts help underscore the importance of finding market “character,” or behavior, and help make sense of seemingly random moves.
By Corey Rosenbloom, CMT, of Afraid to Trade.com


