
With stocks’ impressive rally now in question, one trader presents a moving-average-based indicator that he has used to more clearly measure market strength.
By Greg Harmon
With the bulls and bears debating over the future direction of the market throughout the last week or so, finding great trade opportunities is getting harder. This makes it a good time to shift from the daily task of taking the market’s vital signs to conducting a broader set of exams—more like a monthly checkup.
When I do this, one of the indicators I look at to confirm the mood is the percentage of S&P 500 stocks that are over their 200-day simple moving averages (SMAs). Below is a weekly chart of this indicator over the last seven years with a chart of the S&P 500 Index below that for comparison.
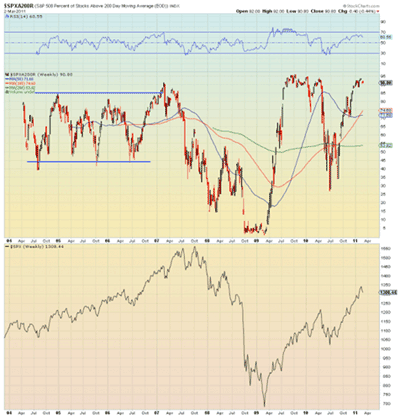
Click to Enlarge
This indicator acts like an oscillator in some ways. It will move between 0 and 100 and becomes more difficult to advance in either direction as it gets toward extremes. It also has an inherent bias to the upper part of the range in a bullish market and the lower part in a bearish market. It can be seen that it moves around a lot, even in a trending market. Look at the channel between 45 and 85 with eight different moves during the rising market from 2004 to 2007.
But it is an imperfect indicator, sometimes leading and sometimes lagging. Notice that as it broke from the highs in mid-2007, the S&P 500 did not follow for several months. Also, as the indicator bottomed in late-2008, the market continued lower and started rising before the indicator. Clearly, this is not an indicator for a daytrader. But looking at the peaks in the relative strength index (RSI) of the indicator tells a different story. Whenever the RSI has either hit the technically overbought or oversold levels—70 and 30—or moved with a steep slope, it has presaged a move in the S&P.
So what does it tell me now? Although the indicator is very close to the extreme, currently at 90.80, it has been higher. Also, it has not touched an RSI of 70 and does not look to be making a steep move lower. This would indicate that the current pullback will be limited, unless this changes. This indicator should not be used by itself, but it can be a good addition to your toolbox. With a moderate time horizon, it can help drown out some “noise” on the charts.
By Greg Harmon, trader and blogger, DragonflyCap.com


