
A reliable reversal indicator has begun flashing warning signs about a potential turnaround in the markets, and traders with existing long positions should be prepared to close out and book hard-earned profits.
It’s been a hectic couple of weeks in the stock market recently, and based on the indicator below, we are reaching a point where, as traders, we need to look for places to start booking gains on our long positions.
You have some news after the close on Friday about another CME notice that raises initial margin requirements to 1.0 across the board on all margin products. Then you also have additional Greek uncertainty and fractures in the bailout coalition. Not to mention the market is as overbought as it has been in quite some time.
For those who are not already familiar with the SharePlanner Reversal Indicator, here’s a quick tutorial:
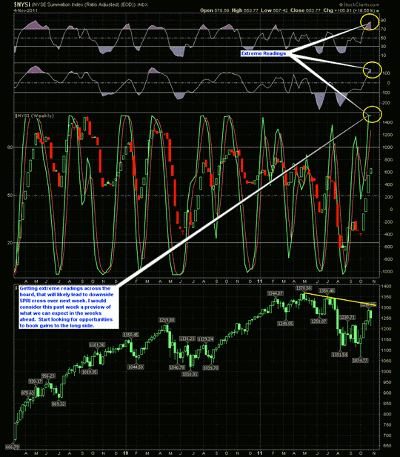
The Indicator uses the Advance/Decline (A/D) ratio with a stochastics overlay. The bottom half of the chart is the weekly candles of the S&P. The chart itself goes back two years. Some folks have criticized me for posting this chart in the past, saying that it isn’t 100% accurate, but if it was, as some think it must be, then I wouldn’t be posting it. I’d save it all for myself and make an ungodly sum of money off of it.
It isn’t perfect, and there is always a level of error that you can expect from it. But overall, it is fairly accurate, and when the indicator hits certain extremes on the stochastics, it is often a good time to start hedging positions that are going against the direction of the indicators, or start loading up on short or long positions in line with the direction that the indicator itself is pointing.
Remember, the extremes are where you want to pay the closest attention, particularly where the %K & %D lines cross (i.e. the red and green lines). This is typically where we begin to see changes in the behavior of the market—not always, but quite often enough to warrant our attention.
What this tool is best for, in terms of what I use it for, is market timing and position building. When there is a crossover at one of the extremes that goes against the positions in my portfolio, I often times look to take profits in those positions or at least hedge against them.
Here is a visual look at the SharePlanner Reversal Indicator:
Click to Enlarge
By Ryan Mallory of SharePlanner.com


