
Ongoing consolidation on the charts for Covidien (COV) is likely to precede a new wave higher or a sizable correction, writes Greg Harmon of Dragonfly Capital, explaining how to play either scenario.
Covidien (COV) has had a great run higher out of the bottoming process of late 2011 into early January. Now, depending on your point of view, it is either “tired” or “poised and resting” for the next move.
Whatever your definition of consolidation, this stock is serving up an opportunity. Take a look at the chart below. The consolidation began after a move back above the high from March through May of 2010 at $51.20.
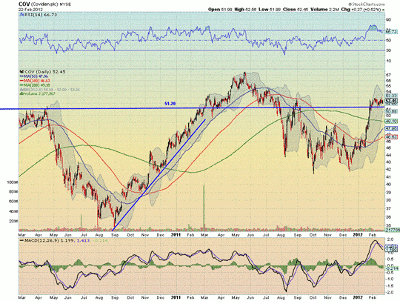
Click to Enlarge
This level up to the top of the consolidation zone at $53 also played a role in March 2011 on the way higher and the summer of 2011 as support on the ride lower. The point is there is a lot of price history in this range.
You can make a case for a bullish breakout with the Relative Strength Index (RSI) bullish and in the mid 60’s, or for a breakdown with the Moving Average Convergence Divergence (MACD) indicator growing more negative by the day.
Zooming in on the last nine months of this chart below, however, highlights what makes it interesting for me. The Bollinger bands, a measure of volatility, are squeezing and getting very tight. This portends a move very soon.
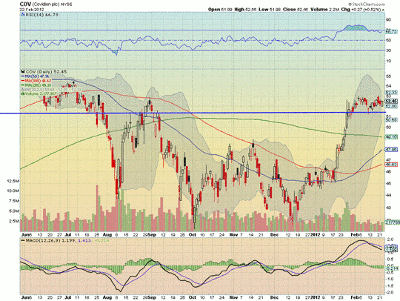
Click to Enlarge
My bias would be to the upside, and a break of the consolidation or bull flag higher has a measured move to $59.50. If it breaks to the downside, support comes at $48 first. That’s $6 of upside or $4 of downside. So why not just take the trade it gives you instead of biasing your view with words like “resting,” “poised,” or “tired.”
By Greg Harmon of Dragonfly Capital


