
The staff at FXTimes.com explains how to spot bullish and bearish pin bars within trends, how to spot price rejection patterns and what is required to be qualified as a legitimate reversal pin bar.
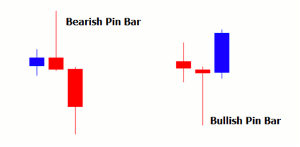
A pin bar trade setup shows strong rejection of price, mostly around some key level, consequently indicating a potential change or continuity in the existing trend. A bar with a head on top is called bullish pin bar while a bar with a head on bottom is known as bearish pin bar as demonstrated in the following diagram:
Click to Enlarge
To be qualified as a legitimate reversal pin bar; following requirements need to be fulfilled by the pin bar candle:
- Wick (also known as the tail or shadow) should be at least three times long as compared to the body (head of the pin bar)
- Body should be at the end of the bar, not in the middle.
- Longer the size of the pin bar, higher will be the reliability
A bullish reversal signal is generated when a bullish pin bar emerges within the bearish trend while a bearish reversal signal is generated when a bearish pin bar emerges within the bullish trend. The emergence of bullish or bearish pin bars within the same trend hints at the continuity of the trend.
How to Identify the Trend?
If the price prints a Higher High or Higher Low as compared to the high or low of the previous wave then the trend is perceived to be upward or bullish. Similarly, if the price prints a Lower Low or Lower High compared with the low or high of the previous wave then the trend is considered bullish. It is pertinent to mention here that the swing analysis should be carried out on higher timeframes such as daily, weekly, or monthly.
The trend may also be identified with the help of moving averages. If the price is hovering above the moving average, then the trend is considered bullish, while, if the price is below the moving average, then the trend is bearish. Some important moving averages include 100-Simple Moving Average (SMA), 200-SMA, and 50-SMA.
How to Trade the Pin Bar
Once the trend has been identified, then all you need is to trade in the direction of the trend with the help of a pin bar formation. For example, if the trend is bullish then only buy opportunities should be considered whereas in the bearish trend only sell options are considered feasible.
The reliability of the pin bar setup is considered far higher when it emerges near some key support or resistance area. The resistance or support area may be identified through Fibonacci levels, trendline, swing levels, moving averages, or price patterns. For example, consider the following AUD/USD chart:
Click to Enlarge
You can see that the bullish pin bar near a key support area (within the bearish trend) indicates potential change in the ongoing trend (short-term trend), the overall (long-term trend) remains bullish due to Higher Low (HL) and Higher High (HH) in the recent move. In such cases, traders tend to buy the asset right after the closing of the bullish pin bar; the stop loss is kept at the swing low of the pin bar.
Conclusion
In a nutshell, the first step is to identify the long-term trend through swing analysis or moving average. Once the trend has been identified, then try to find out trade opportunities in the direction of the overall trend. For instance, if the long-term trend is bullish, then you should only look for a bullish pin bar around some key support area in order to open a buy position.
By the Staff of FXTimes.com


