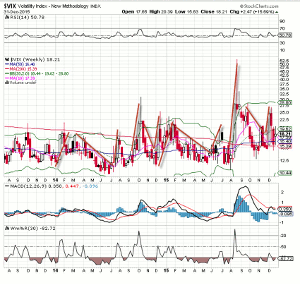
For the benefit of all traders who have seen the ups and downs of the VIX in recent years, Bob Lang, of ExplosiveOptions.net, explains that the psychology of markets never changes, only the movements.
The VIX is an indicator that measures market volatility and it has had its fair share of ups and downs since 2013. As we see from the chart below, the range has been very wide, moving from the 10s up to the low 50s. But what is interesting on this daily chart is the similarities between 2014 and 2015. Strikingly, the VIX patterns are similar in time and price. A definite pattern of market behavior seems to be repeating here, and while each moment is different, the psychology of markets never changes, it is always based on fear and greed.
Here's the volatility pattern that I see in the charts:
Fear seems to rise to begin the year before falling sharply in February as markets start to rally into the spring. To read the entire article click here.
By Bob Lang of ExplosiveOptions.net


