
QuantCycle Oscillator indicates that equities are nearing possible top according to John Rawlins.
There has been a lot of discussion regarding the bullish correction in the equity market. Is it getting old? Will the bear roar back? Does there need to be a correction to the correction before we can determine the broader market direction?
Let’s see what the QuantCycle Oscillator is indicating.
While there no dramatic consensus, the QuantCycle is indicating that we could be nearing a substantial top in stocks.
The most compelling example is in the Russell 2000 (see chart).
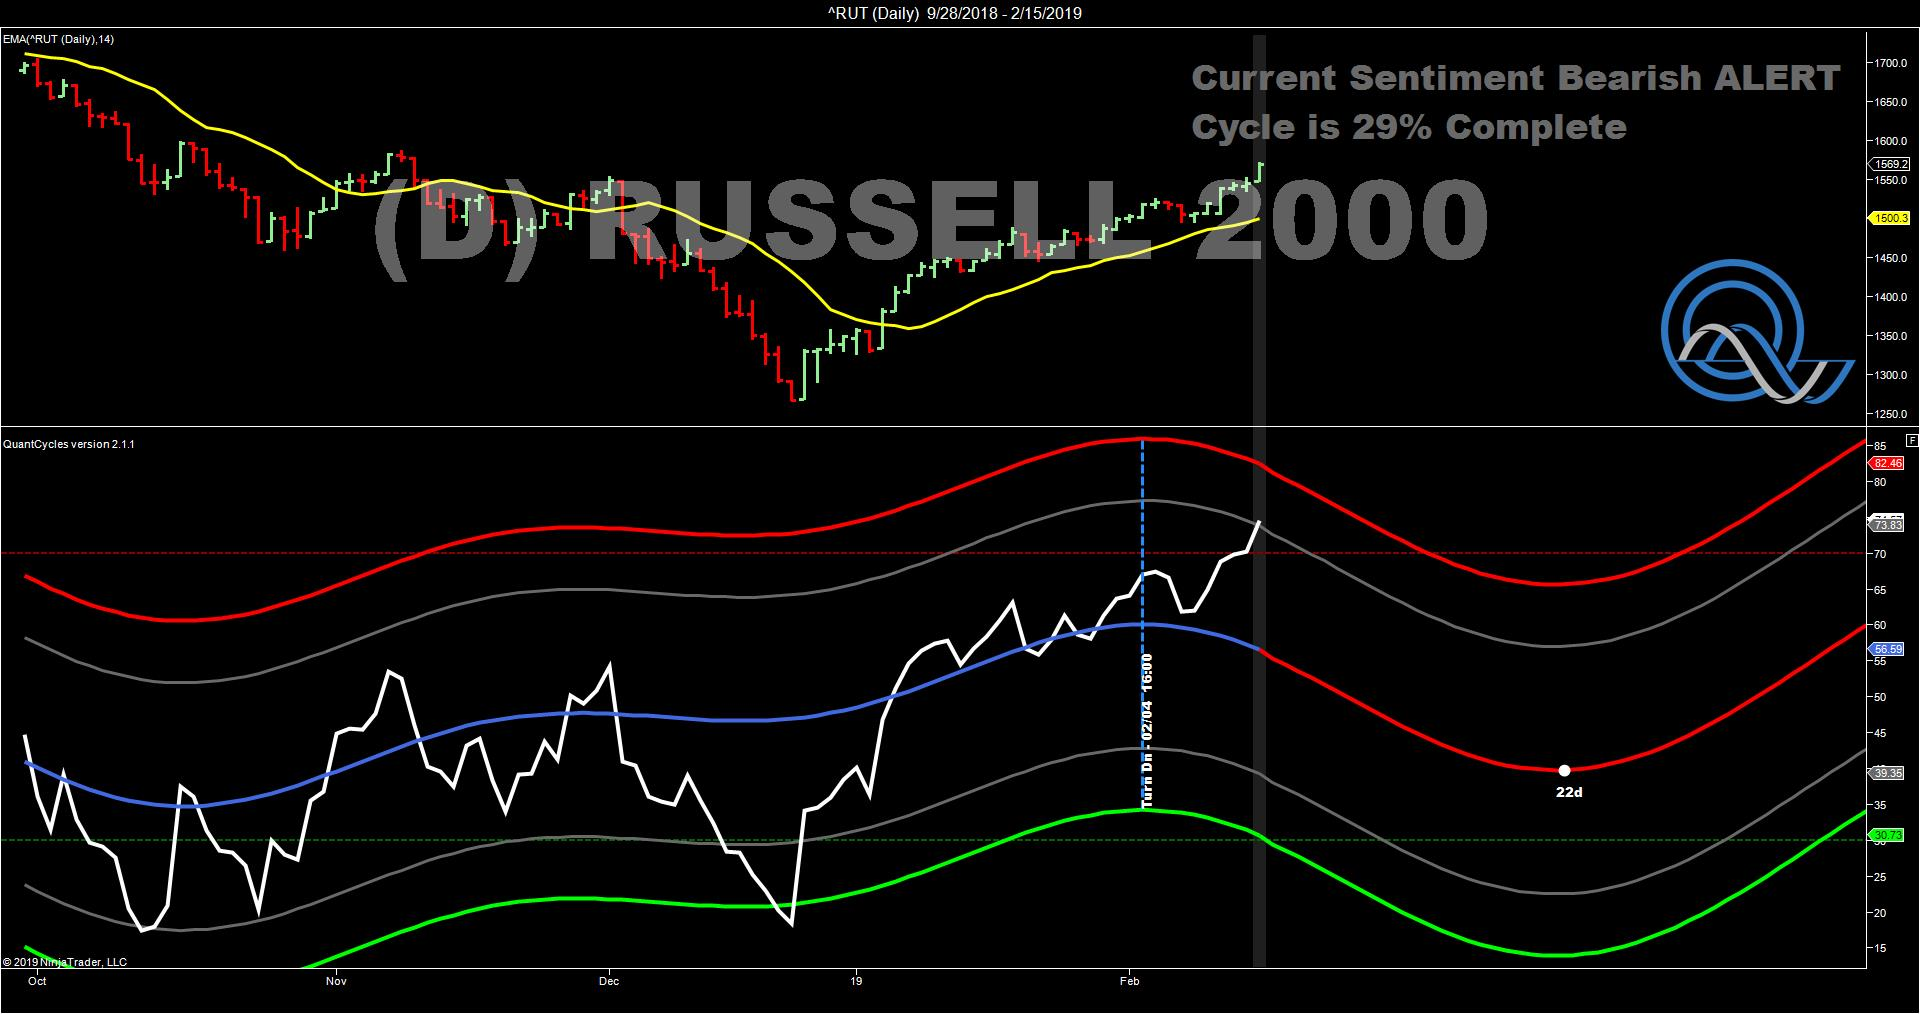
The RUT is closing in on overbought territory, and the QuantCycle turned lower early in February. The oscillator expects the Russell to decline over the next three weeks.
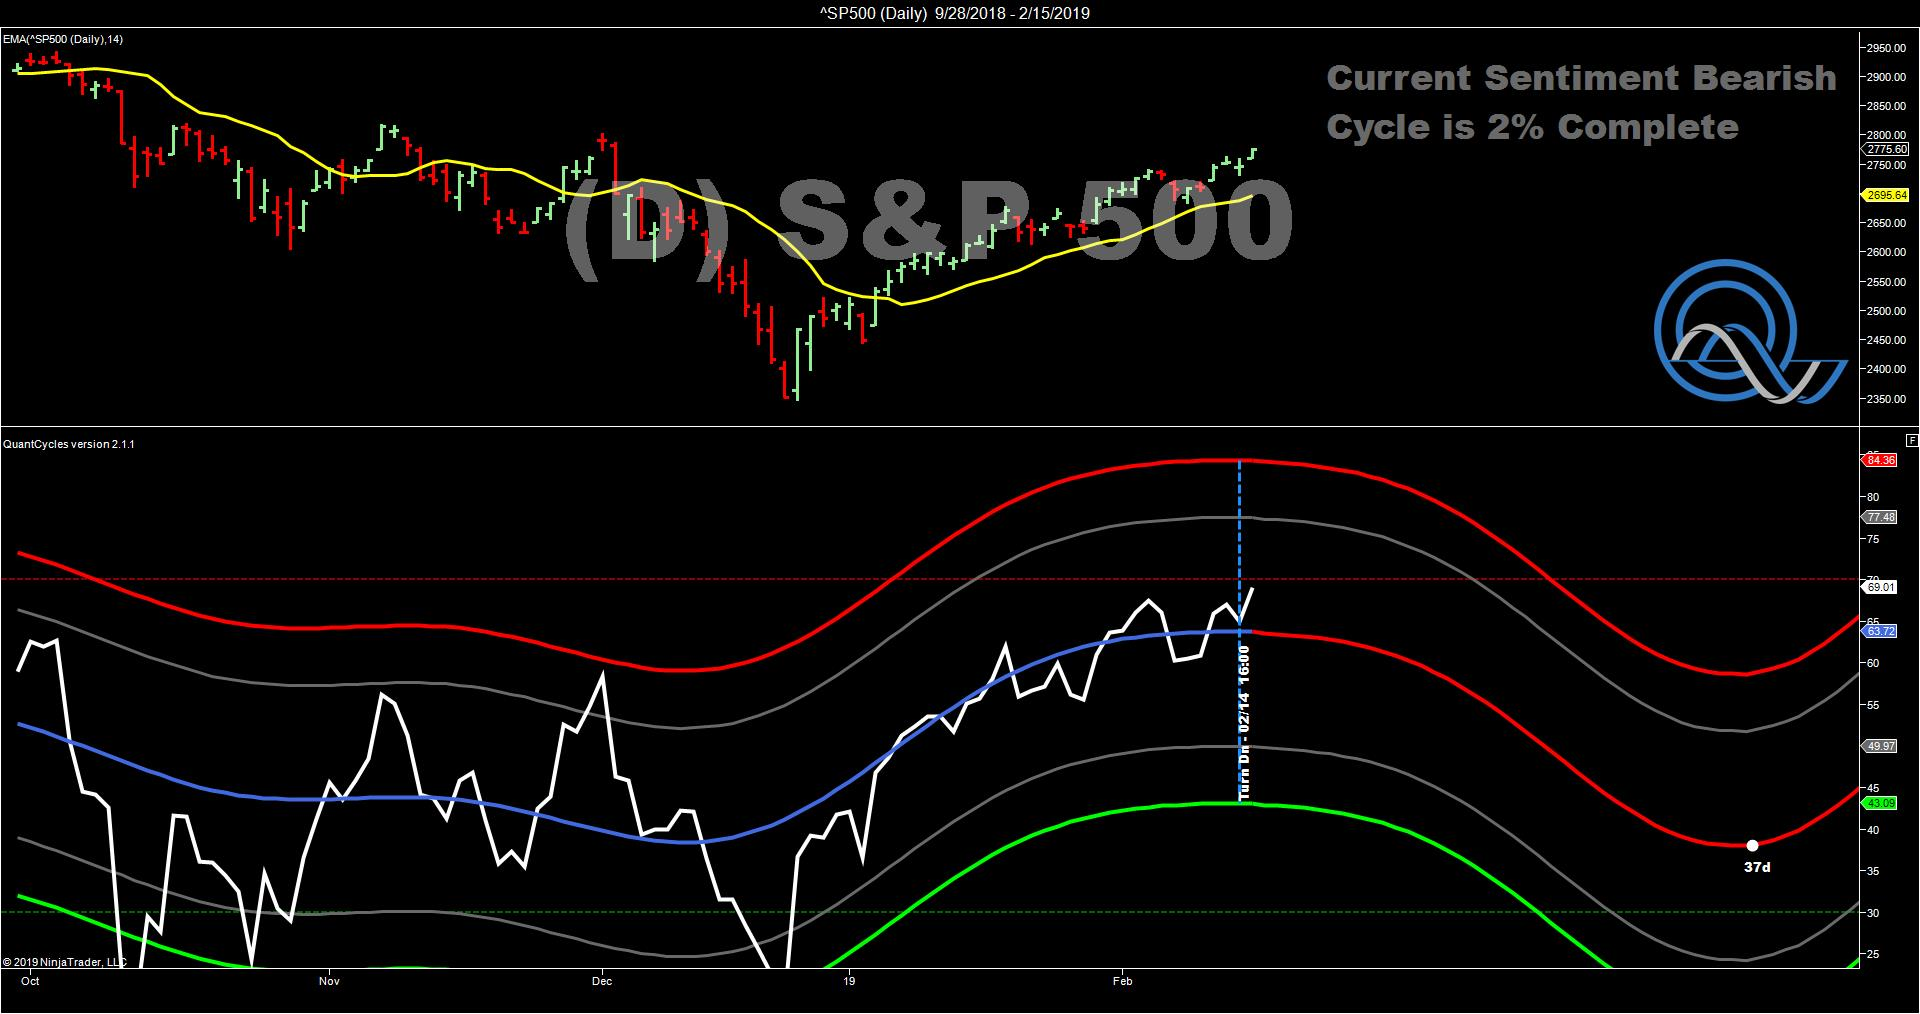
The daily QuantCycle on the S&P 500 just turned bearish, but it is not nearly as overbought as the Russell. Still it is a confirming signal and it shows the S&P 500 dropping significantly over the next month.
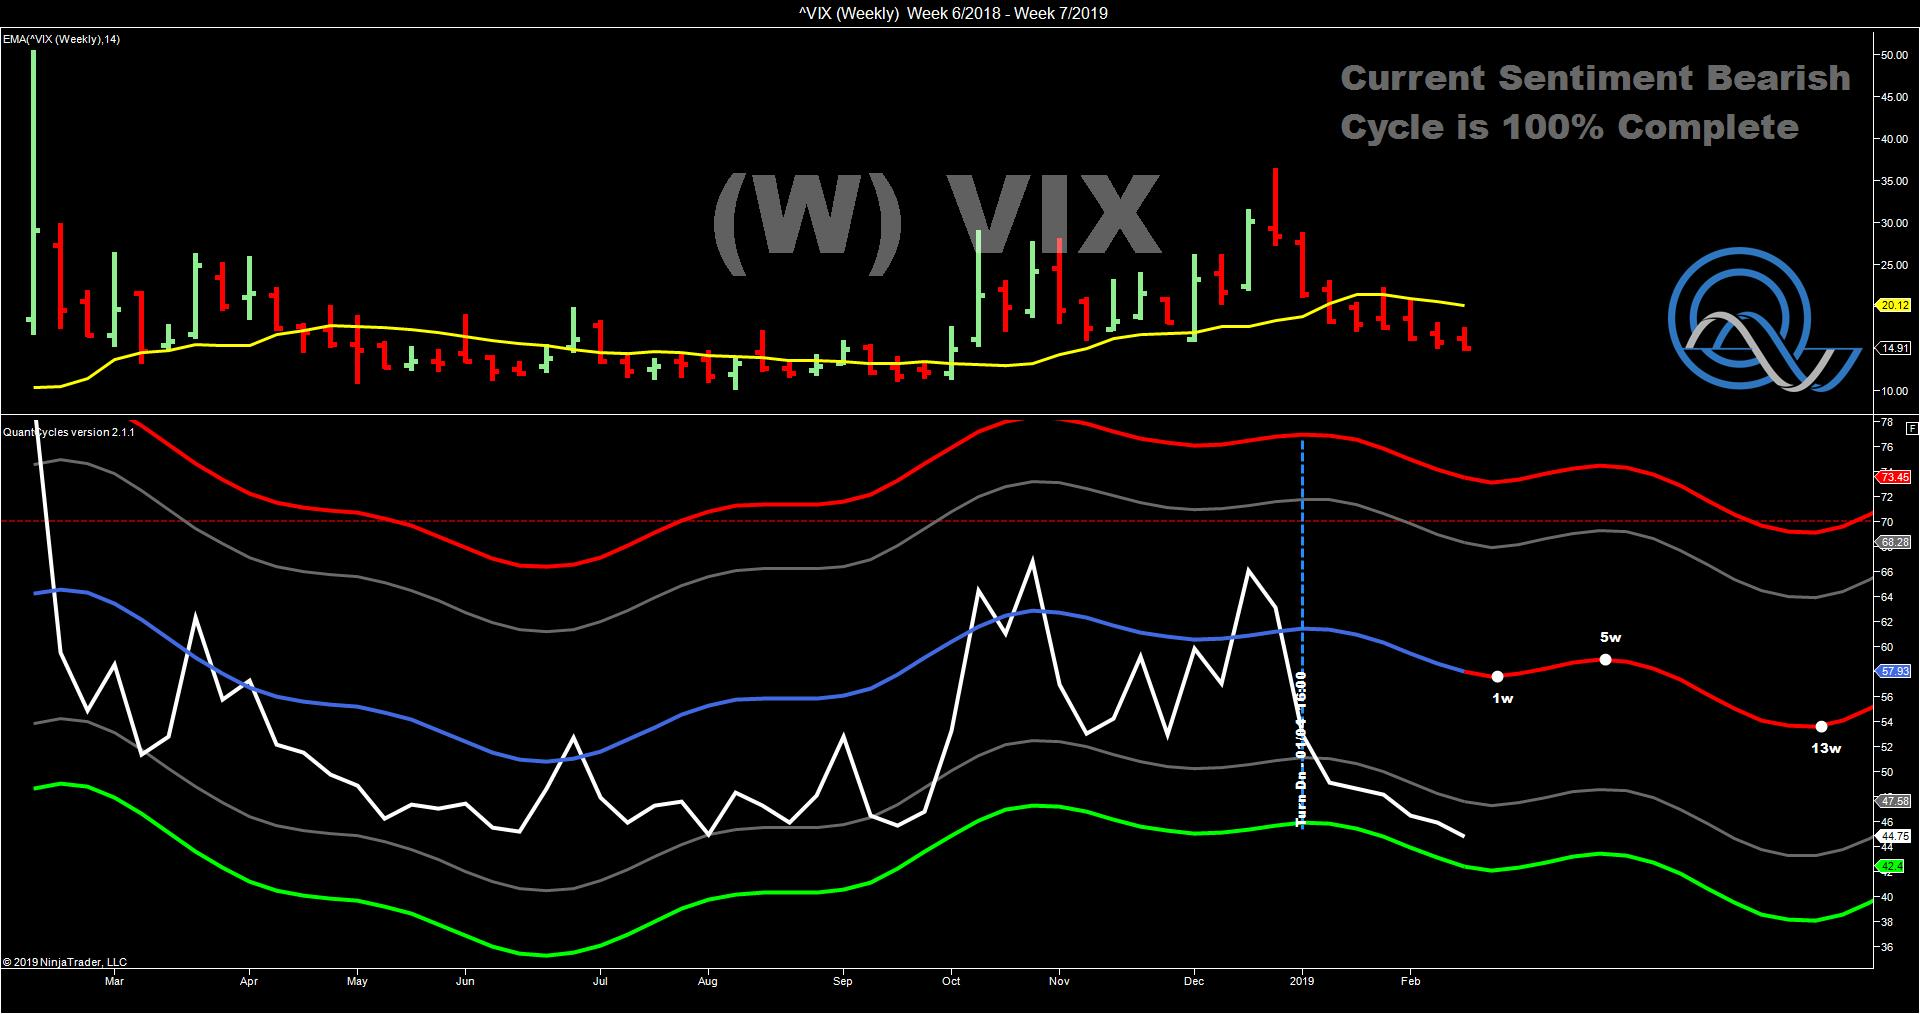
But what does the CBOE Volatility Index (VIX) show. It is interesting. The long-term weekly VIX shows that the fear gauge is nearing extreme oversold territory, i.e. volatility should rise in the near term. The QuantCycle also expects the VIX to turn higher in the near term.
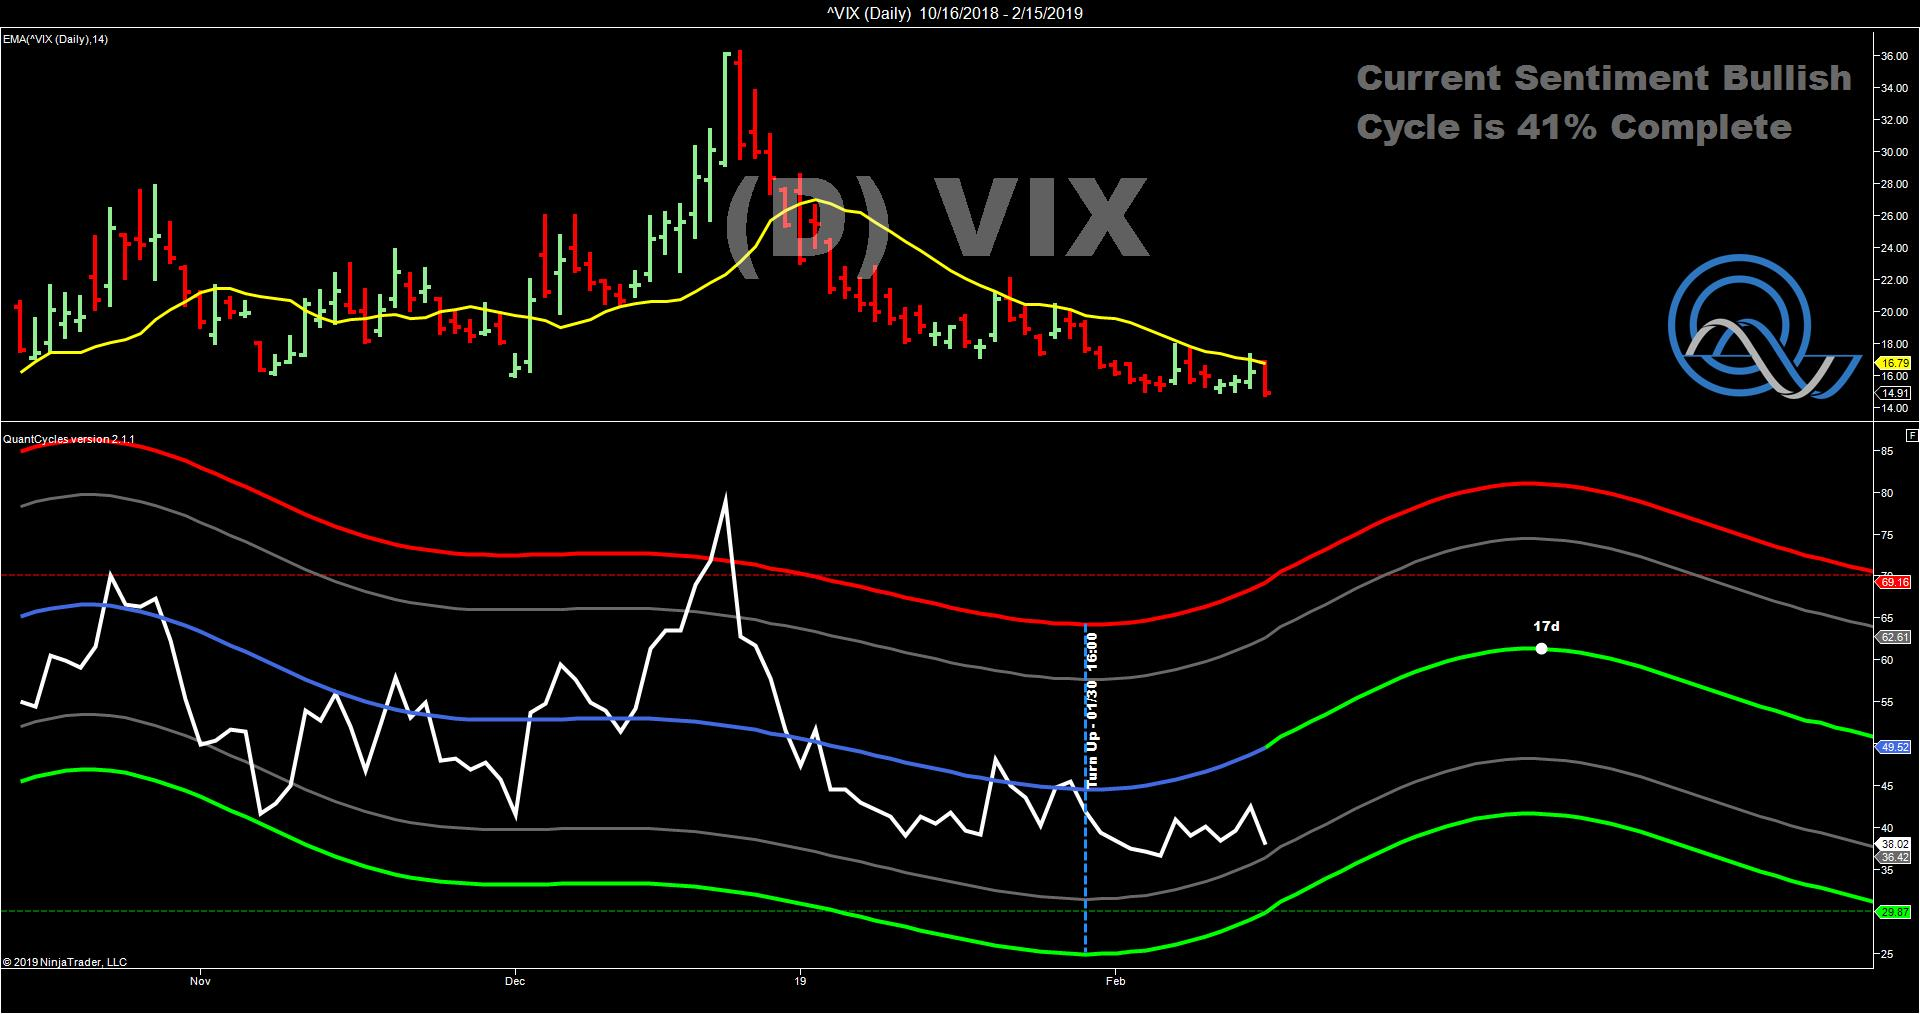
When you look at the daily VIX QuantCycle, it is more apparent that it is expecting a short-term rise in volatility over the next three weeks.
However, if you look once again at the weekly QuantCycle, it is clearly indicating a choppy decline over the next three months. The QuantCycle is also indicating that the Russell and S&P will bottom some time around opening day.
It is apparent that the QuantCycle is indicating there may be a near-term top in equity indexes, but that top may be temporary and the rally that began at the end of the year may resume. Whether this is a resumption of the Q4 sell-off or a short-term correction in the current bullish momentum is yet to be known. However, it could be a good time to take short-term profits.
The QuantCycle indicator is a technical tool that employs proprietary statistical techniques and complex algorithms to filter multiple cycles from historical data, combines them to obtain cyclical information from price data and then gives a graphical representation of their predictive behavior (center line forecast). Other proprietary frequency techniques are then employed to obtain the cycles embedded in the prices. The upper and lower bands of the oscillator represent a two-standard deviation move from the predictive price band and are indicative of extreme overbought/oversold conditions.


