
Traders may want to prepare for bearish October returns, if history is any guide, reports Rocky White.
Next Tuesday, Oct. 1, the fourth quarter of 2019 officially begins. It hasn't been that long since the major fourth-quarter 2018 sell-off, which was pretty brutal for the stock market. The 9.2% decline in the S&P 500 Index last December was its worst monthly loss of the last decade, and the roughly 14% October to December retreat by the S&P was the second-biggest quarterly drop of the last 20 years.
More broadly, though, the fourth quarter tends to be a bullish period for equities. This week, I'll take a look at the returns a few different ways to see what we might expect from the SPX through the rest of calendar year 2019.
Q4 Skews Bullish, But Often Volatile
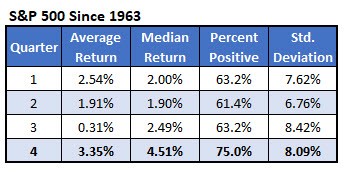
First, here is some simple quarterly seasonality data. In the first table, I went back to 1963, because that’s how far back the Investors Intelligence sentiment survey data goes. Over this long-haul time frame, the fourth quarter has been the most bullish for the SPX, in terms of average return (3.35%), median return (4.51%), and percent positive (75%) — although it's also near the top of the heap in terms of volatility of returns, as shown by the standard deviation of 8.09%.
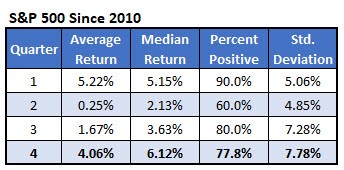
This next table zooms in on quarterly returns since 2010, during the current bull market. The fourth quarter is still bullish, with an average return of 4.06%, although it's not quite as strong as the first quarter's 5.22% mean performance. What's more, since 2010, the fourth quarter's percentage of positive returns has improved to 77.8% — but that falls short of 90% positive first-quarter returns, and 80% positive third-quarter returns.
Two areas where Q4 still leads the pack, though, are in terms of median return (6.12%) and standard deviation of returns, at 7.78%.
Q4 Returns in Bull Markets
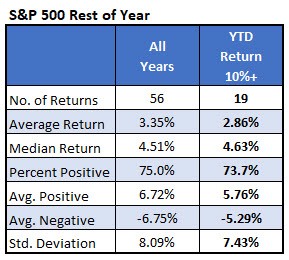
Returning to our set of S&P returns since 1963, this next table compares fourth-quarter returns for all years against only those years where the index was up 10% or more through the first three quarters, as it is heading into the fourth quarter of 2019. Either way, the rest-of-year returns are bullish — though they're slightly less bullish when the SPX is already up big going into the final three-month stretch of the year.
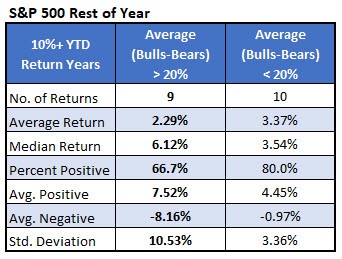
This next table splits up those 19 returns where the index was up 10% or more and breaks them down by whether the average Investors Intelligence bulls-minus-bears reading for the year was over or under 20%. Over 20% — where we are now — would indicate a high level of optimism, on average, while under 20% would indicate relative pessimism.
Again, the average fourth-quarter returns aren’t too bad either way, but they've been marginally better when the Investors Intelligence poll showed less optimism. Additionally, note the big difference in standard deviation of returns, as underscored by the average positive and negative returns for each group. Volatility seems significantly higher when the SPX is up at least 10% going into the fourth quarter and optimism dominates in the Investors Intelligence survey.
Why October Could be a Bearish Month
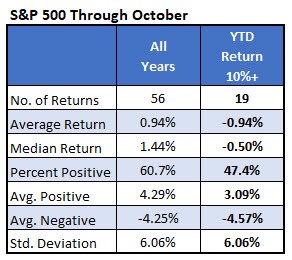
The two tables below are similar to those above, except they summarize only October returns. When the SPX is up 10% or more year-to-date through the end of September, then October is a bearish month — averaging a 0.94% loss, versus its typical 0.94% gain, and finishing positive less than half the time.
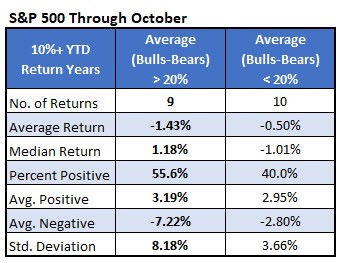
Then, I broke down those 19 returns again by the average bulls-minus-bears reading for the year. While the data points to a negative monthly finish either way, the average return is worse when the bulls-minus-bears line average is above 20%. Note that this data set includes October 1987, the month of Black Monday.
Sign up here for the Schaeffer’s Research Edge weekly newsletter


