
Bitcoin has lost more than 50% since its June 2019 peak, but the technicals are turning, notes Matt Weller.
While it pales in comparison to previous bear markets (prominently including 2018’s 85% drop from nearly $20,000 to a low of $3,200), there’s no denying that sellers have been in control of bitcoin over the last six months.
Since peaking just below $14,000 in late June, bitcoin has put in a consistent series of lower highs and lower lows, culminating (so far) with the mid-December low under $6,500.
Ho-hum, just another run-of-the-mill 50% crash in the world’s oldest cryptocurrency.
As any diehard bitcoin holder will tell you though, developers continue to improve the underlying bitcoin protocol regardless of price movements. While the much-anticipated bitcoin exchange trade fund (ETF) has yet to garner U.S. regulatory approval, a series of other upgrades have come online in recent years, including the faster, cheaper “lightning network” layer-2 solution, as well as the space-saving Segregated Witness (SegWit) proposal. Looking ahead, developments like more efficient Schnorr signatures (a digital signature that could enhance the practical uses for cryptocurrencies) and privacy-enhancing Taproot could be future catalysts for improved functionality.
At the end of the day though, what traders are most interested in are the price movements, and from that perspective, there are some clear technical signs that bitcoin’s recent downtrend may be coming to an end.
Quietly, BTC/USD has rallied more than 20% in the past three weeks and is probing its highest levels since late November. More to the point, this rally has come in the context of a classic inverted head-and-shoulders pattern. For the uninitiated, this pattern shows a transition from a textbook downtrend (lower highs and lower lows) to an uptrend (higher highs and higher lows) and is often seen at significant bottoms in the market (see chart).
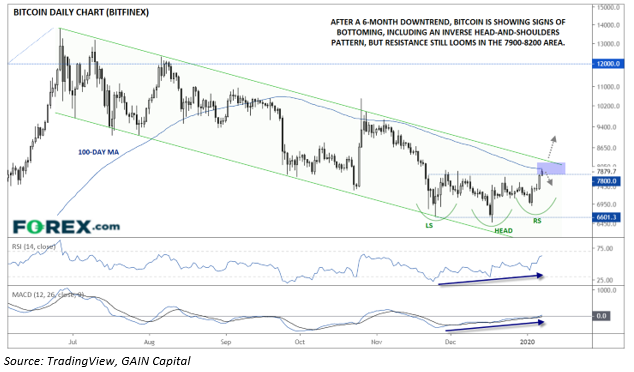
Source: TradingView, GAIN Capital
The fact that both the Relative Strength Index (RSI) and MACD indicators have been trending higher since late November (despite the marginal “lower low” in price) confirms that the selling pressure is drying up, a necessary precursor to the start of a new uptrend.
That said, bulls are far from out of the woods. Bitcoin is currently testing its 100-day moving average and remains within the bearish channel off its June peak. A confirmed break above this resistance zone in the $7,900 to $8,200 area is needed to confirm a shift in the medium-term downtrend.
Bulls can take solace that at least, after a six-month period of frustration and despair, there are some proverbial “green shoots” at the start of 2020.
Come get the most current analysis on Bitcoin and the cryptocurrency sector at the Crypto Intelligence Special Track at TradersEXPO New York, Hear what Matt Well had to say about Geopolitics, Economics and the Forex Markets at the recent Las Vegas TradersExpo. Matt Weller | Global Head of Market Research | GAIN Capital mweller@gaincapital.com | w: www.forex.com & www.cityindex.co.uk


