
Numerous exploitable bullish patterns are forming in the semiconductor sector, reports Suri Duddella.
After the Coronavirus influenced market sell-off, some of the Semiconductor sector stocks are seeing a bounce as they show bullish patterns.
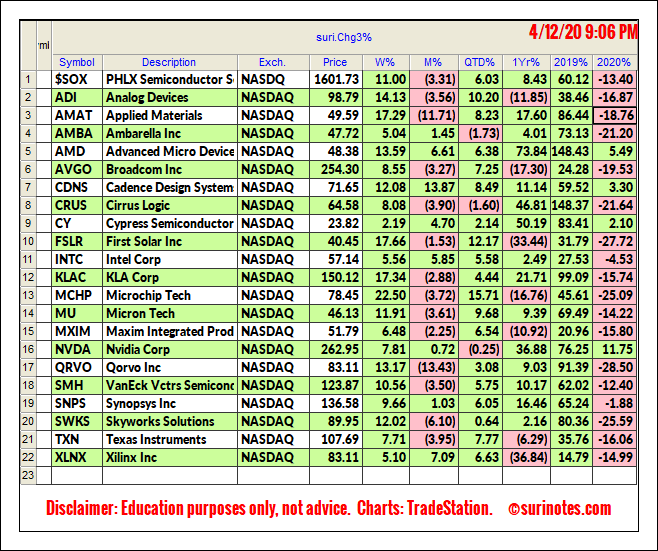
Here is a list of Semi-Conductor stocks:
Inverse Head & Shoulders Pattern
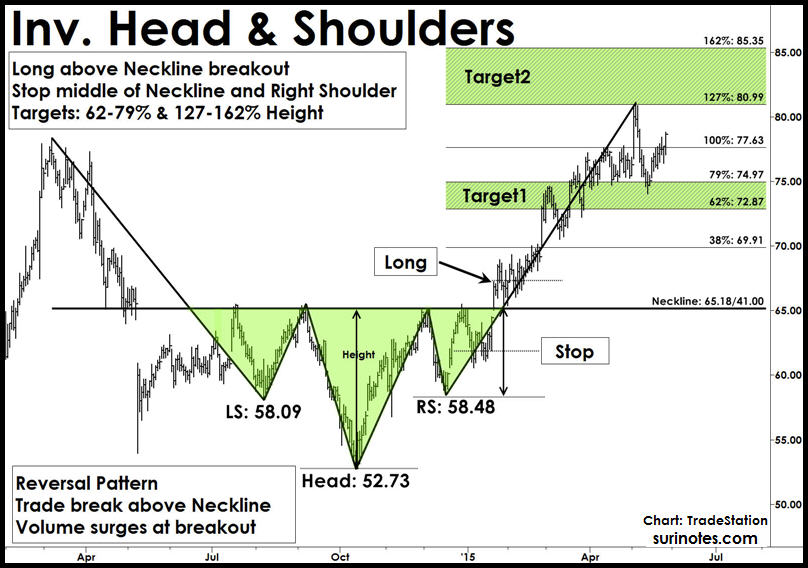
One of the most popular chart patterns in market analysis is the Head and Shoulders Pattern. The Head and Shoulders Pattern forms near market tops in an established sideways to up-trending or bullish markets. It is a reversal patterns as it reverses the prior uptrend and follows a bearish or downtrend from its breakdown.
These patterns are signified by three successive peaks (tops) resembling two shoulders on both sides and a head in the middle. The head is the largest of the three peaks. An Inverse Head and Shoulders Pattern is the head and shoulders pattern upside down (mirror image) and follows a similar structure and trading rules in reverse. The Inverse Head and Shoulders Pattern is also a reversal patterns and form in established downtrends.
Trading Inverse Head & Shoulders Pattern
Entry: After right-shoulder formation and pattern completion, if price closes above the neckline with increased volume, enter a long trade above the breakout bar's high.
Stop-loss: 1. Place a stop below the middle of neckline and right-shoulder 2. Place a final stop below the low of the right shoulder.
Targets: Targets are projected from the neckline level. Measure the height of the head and use Fibonacci ratios to compute targets.
The first target is 62% of the height of the head, and the second target range is 127% above neckline (see chart).
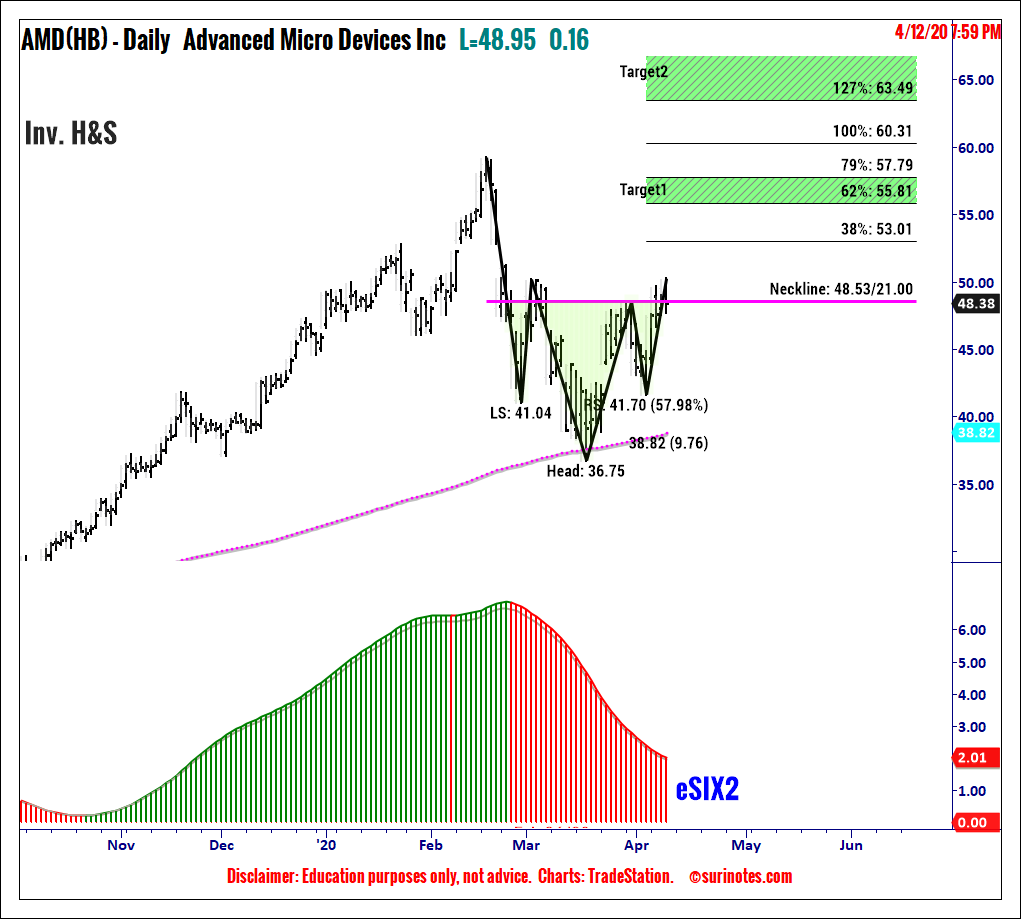
Advanced Micro Devices
In February 2020, after reaching a peak of $58, Advanced Micro Devices (AMD) started to decline during the Coronavirus related market sell-off and formed an Inverse Head and Shoulders pattern. The pattern neckline is $48.53. If prices close above $48.53 with underlying trend confirmation, a long trade may be entered with price targets of $53, $55 and $60 (see chart below). A stop is placed at the mid-level of right shoulders' low and neckline at $44.
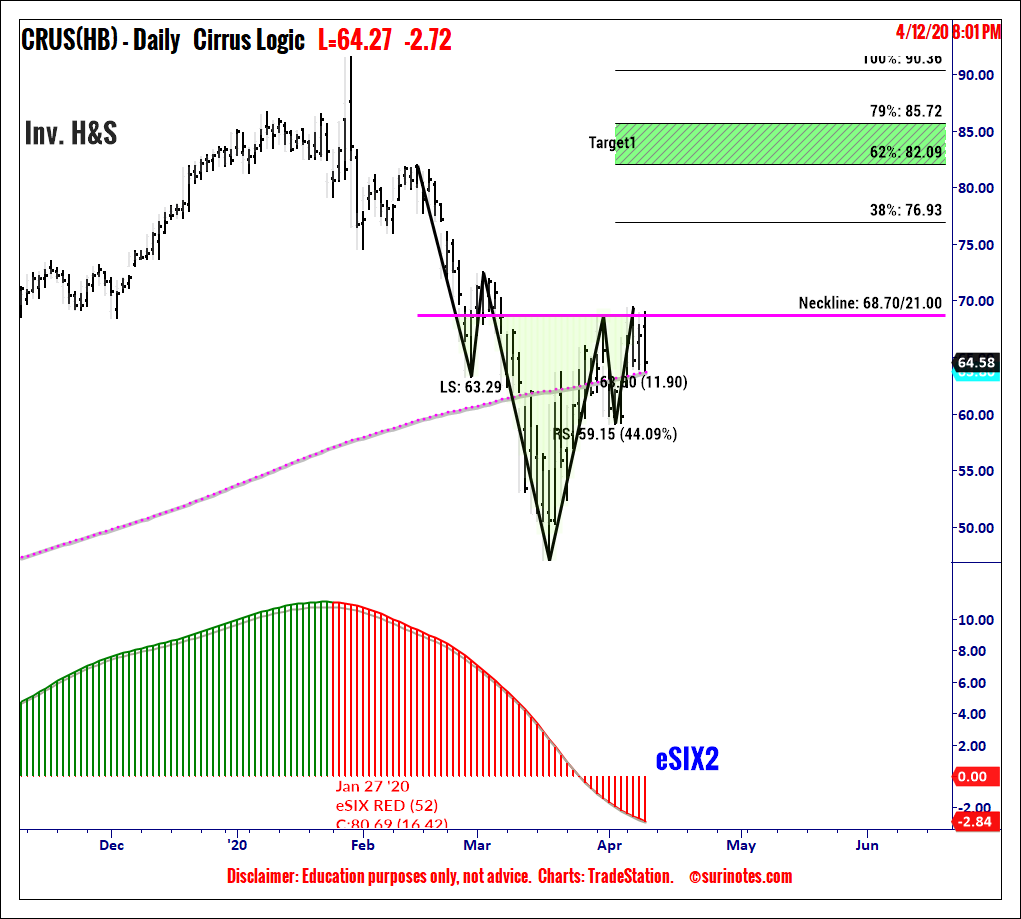
Cirrus Logic
Cirrus logic (CRUS) formed an Inverse Head and Shoulders pattern from mid-February 2020 and April 2020 between $47 and $68. If prices close above neckline ($68.70) with trend confirmations, a long trade may be entered with price targets of $77, $82 and $85.50 (see chart below). A stop may be placed below the mid-level of right shoulder's low $59. and neckline at $64.
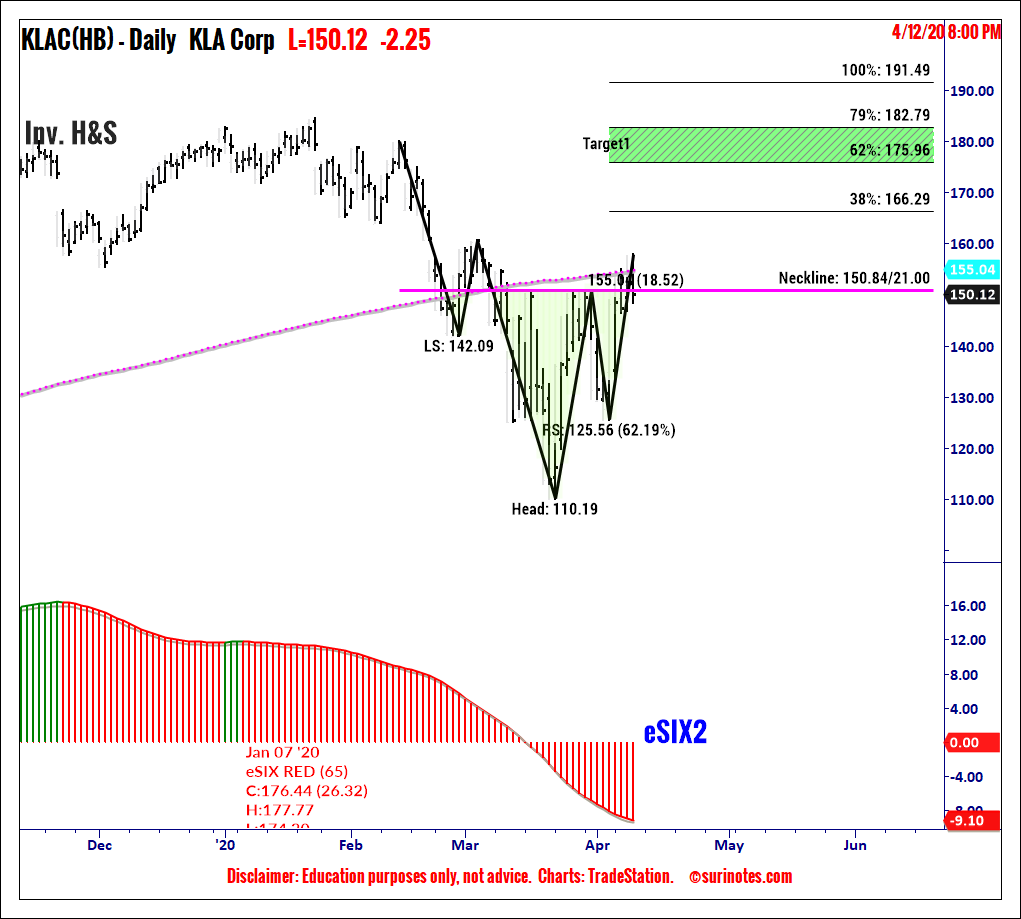
KLA Corp.
KLA Corp. (KLAC) formed an Inverse Head and Shoulders Pattern from March and April 2020 between $110 and $155. If prices close above neckline with trend confirmation, a long trade maybe entered with targets of $166, $175 and $183 (see chart below). A stop may be placed at the mid-level of right shoulder's low and neckline.
Find more of Suri’s work at surinotes.com.


