
In our series on Risk Parity, Michael Rulle discusses the Tangency Portfolio.
In our two previous posts — The Invisible Gorilla & Risk Parity and The Invisible Gorilla, Benchmarks & the Efficient Frontier — we discussed how an experiment in perception framing revealed to us a better portfolio construction strategy.
We learned from the “Invisible Gorilla” experiment that we often can be blinded by these perceptions.
We then went about building a 50-50 Risk Parity portfolio that dynamically weighted our equity and fixed income constituents based on risk.
Here we discuss the Tangency Portfolio in more detail.
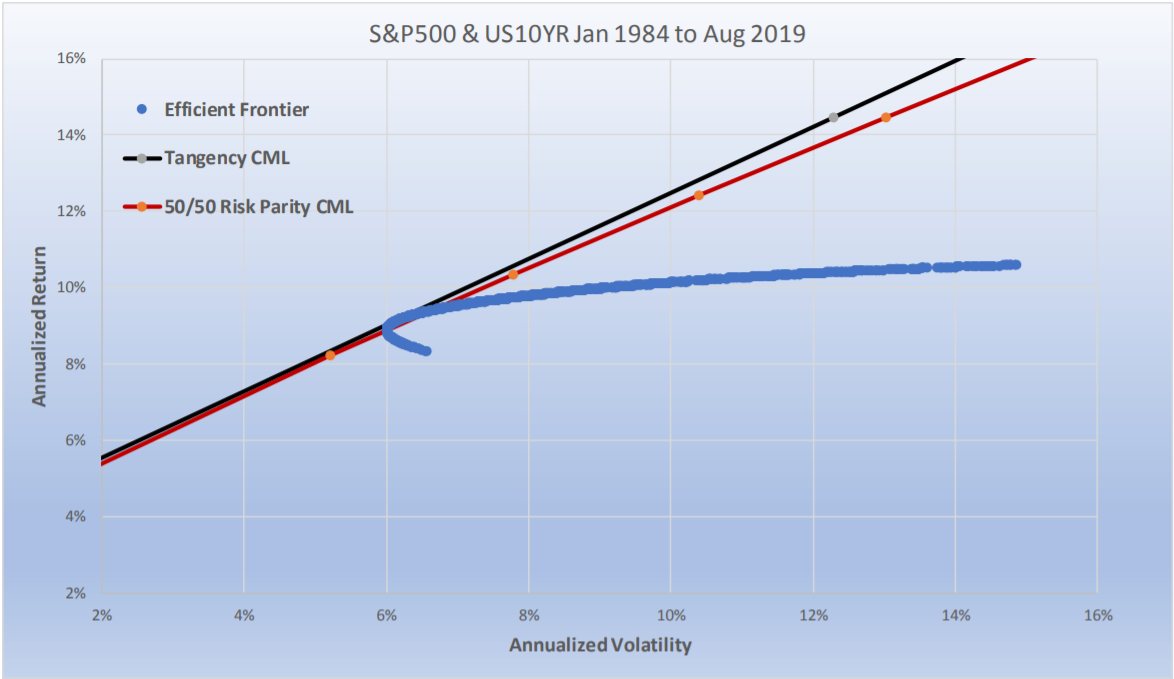
Since 1984, the ex-post, or “after the fact”, Tangency Portfolio of stocks and bonds had a notional weighting of 75% 10-year Treasury notes and 25% S&P 500. The average notional weighting for this 36-year period for the Risk Parity portfolio was 70% 10-year Treasury notes and 30% S&P 500. From 1974 to 2019, the ex-post Tangency portfolio weighting of the U.S. Total Stock Market and the Long-Term Corporate Bond market had virtually the exact weighting of Risk Parity’s average weighting (35% equities and 65% bonds). We wonder how many investors were aware that the highest Sharpe ratio portfolio had that much fixed income. However, there is one major problem with the Tangency Portfolio— one cannot invest in it.
The reason is it was not known until after the fact. One could have invested in Risk Parity, however. And Risk Parity will almost always be very similar to the ex-post Tangency Portfolio over long periods of time. The chart below shows that the Risk Parity portfolio sits right near the Tangency Portfolio on the Efficient Frontier (from 1984-2019). Furthermore, the 50/50 Risk Parity Capital Market Line, drawn for different levels of volatility like the Tangency Capital Market Line, sits just below the Tangency Portfolio Capital Market Line. The Tangency Portfolio and are “after the fact” fixed weightings and cannot be known in advance. Therefore, it cannot be implemented. The Sharpe ratio for the (unattainable) Tangency Portfolio was 0.85, while the easily implementable 50/50 Risk Parity Strategy was a very close 0.83.
This is not as surprising as it might first appear. First, there is a range of weightings where the Sharpe ratios of the two portfolios are almost the same. Secondly, Risk Parity is trying to equally risk weight two low correlated (on average) assets of Treasuries and equities, which have similar expected long-term Sharpe ratios. In fact, it would be very surprising if the long-term ex-post Tangency Portfolio had a materially different Sharpe ratio than Risk Parity.
Many critics of Risk Parity have pointed out that Sharpe ratios are suboptimal in any portfolio when one is risk weighting asset classes with materially different Sharpe ratios. We agree. Furthermore, for shorter timeframes we expect the Tangency Portfolio (i.e., the highest Sharpe ratio portfolio for the chosen time period) to be very different than the Risk Parity portfolio (or any other portfolio weighting) as equities and fixed income perform differently from each other during these shorter timeframes. For example, the five-year Tangency Portfolio from 2000-2004 consisted of a 100% weighting to the 10-year Treasury. No amount of equity could have been added to the portfolio to improve the Sharpe ratio. And, it would have taken an omniscient investor to have known that would be the optimal portfolio weighting on the eve before the millennium.
Keep in mind, that for any time period, the Tangency Portfolio, by definition, will always have the highest Sharpe ratio and it will be impossible to know what that is in advance. There will always be a Tangency portfolio for every timeframe that will be better than whatever any investor does. Sometimes the Tangency portfolio will even be 60/40, and sometimes it will be Risk Parity’s average weighting. But the challenge is to achieve as close as possible to the ex-post Tangency Portfolio, given that we do not know what it is in advance.
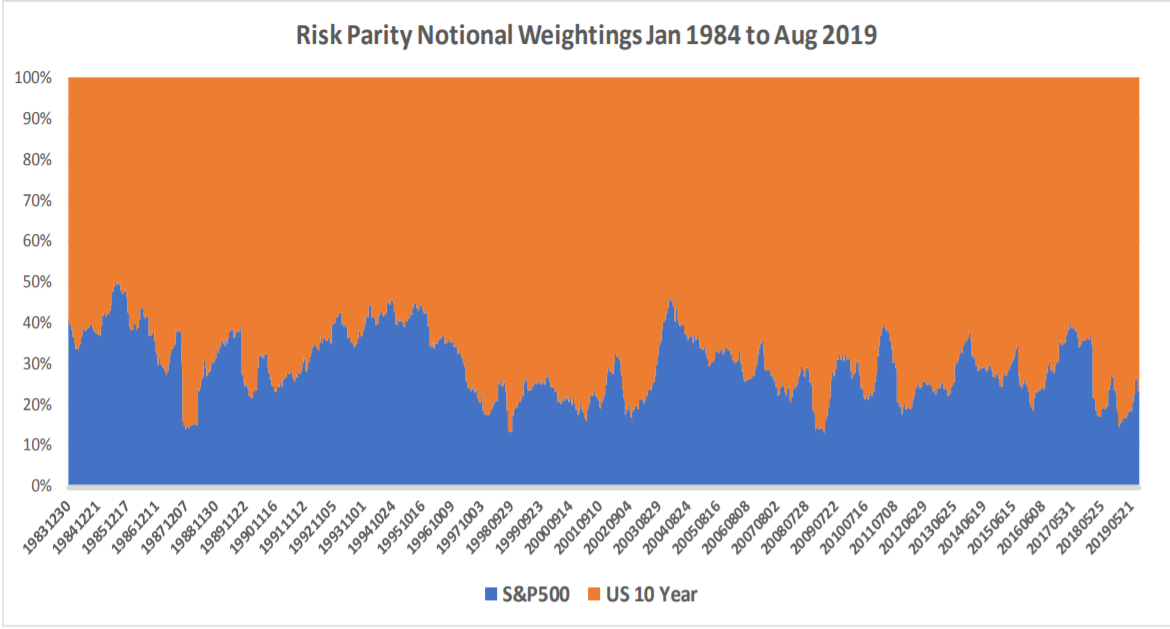
As time expands, Risk Parity’s risk adjusted returns will almost always come increasingly closer to the Tangency portfolio for that time frame. The chart below shows that notional weightings between the two asset classes change through time within a Risk Parity portfolio. The notional weightings change as a result of the comparative volatility of each asset class changing over time. The objective is to maintain equal risk, and as volatility changes equal risk will result in different notional weightings.
In our next installment on risk parity, we will look at the impact of volatility skew.
Michael S. Rulle, Jr. is the founder and CEO of MSR Indices, LLC, a commodity trading advisor that offers an expansive range of index-tracking investment programs. This piece is an excerpt from a white paper titled: “The Gorilla in the Room: The obvious method of asset allocation most of us have never considered.”
Rulle inspired a family of indexes launched by S&P Dow Jones called S&P Risk Parity Indices, Rulle discussed Risk Parity at the 2019 TradersEXPO New York. Prior to founding MSR in 2015, he was president of Graham Capital Management, where he was directly responsible for the firm's discretionary portfolio managers.


