
While the chances of the 30-year bond making a new all-time are real, the odds favor a downside break and there is more room for profits, says Al Brooks.
The U.S. 30-year Treasury bond futures have been trading sideways for four months. There is no sign that the tight trading range is about to end.
The 30-year future has been in a tight trading range on its weekly chart for those four months (see below). It is therefore in a Breakout Mode. That means that there is an equal chance of a successful bull or bear breakout.
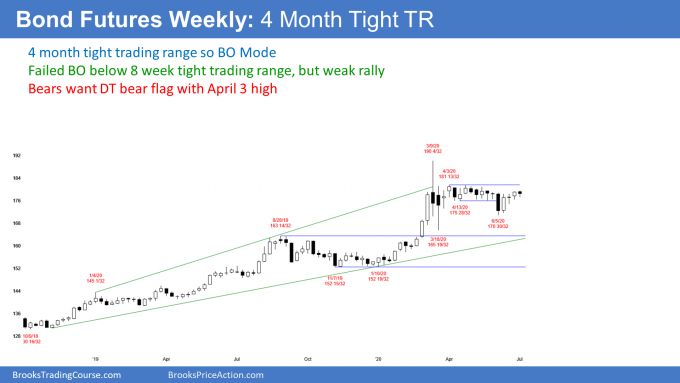
March reversed down strongly after the most dramatic three-month buy climax in the history of the bond market. When that is the case, traders expect about a 10-bar sideways to down move. They look for the highest timeframe that shows the pattern. Here, it is the monthly chart. Traders therefore expect the bond market to be sideways to down for about a year.
There is often one more buy climax before the pullback begins. That is what the bulls are hoping to see. But with each additional sideways month, the odds of that decrease.
Even if they were to get a breakout above the March buy climax high, it would probably fail. There would then be a second reversal down. That would have a higher probability of leading to a swing down.
Target is the bottom of the last leg up
Whether or not there is a new high. traders expect the reversal down to test the bottom of the most recent buy climax. That is the January low. The bottom of the bull leg is the November 2019 low.
Since a correction from a buy climax typically lasts about 10 bars and has at least two legs, it could take a year or more to get there. Furthermore, there might be a bull breakout above the four-month tight trading range before the correction begins.
As I said, the bulls might even get a brief break above the March high before the reversal begins. But if there is a break above the four-month range, it will more likely fail and reverse down from a lower high than from a new all-time high.
What about the mantra, “Gold to infinity, interest rates to zero!”? It sounds good on TV, but that does not make it true. Nothing is going to infinity and the bond charts look like the high is already in.
Trading Room
Traders can see the end of the day bar-by-bar price action report by signing up for free at BrooksPriceAction.com. I talk about the detailed E-mini price action real-time throughout the day in the BrooksPriceAction.com trading room. We offer a two-day free trial.


