Moby Waller of BigTrends.com says a 'Golden Cross' on the gold chart may signal big gains ahead.
Joe Terranova of Virtus Investment Partners was on CNBC this week, and had an interesting tip on how he is looking to trade gold.
Here’s what he said: "The price charts for [the Spyder Gold Trust] (GLD) are approaching a "golden cross"—in which the 50-day moving average surpasses its 200-day moving average.”
He was suggesting the start of a bull market in gold, but is it a buy? "I think everyone should own gold, everyone should own the Silver ETF (SLV). To me, it is the true buy-and-hold asset right now," he said.
But as far as precious metals go, Terranova didn't stop there. "If there is something that I would trade, it would be platinum," he said. "Platinum is a metal that has seen significant short-selling pressure throughout the year. That has been reversed because of the fundamentals we're seeing in South Africa."
Terranova goes on to say that the Platinum ETF (PPLT) was the way to play it.
No options are available on PPLT currently. For platinum, investors and traders may utilize other ETFs such as UBS Long Platinum ETN (PTM) and First Trust ISE Global Platinum Index (PLTM), with a more liquid choice being iShares MSCI South Africa Index (EZA), which holds up to a 25% weighting in platinum miners.
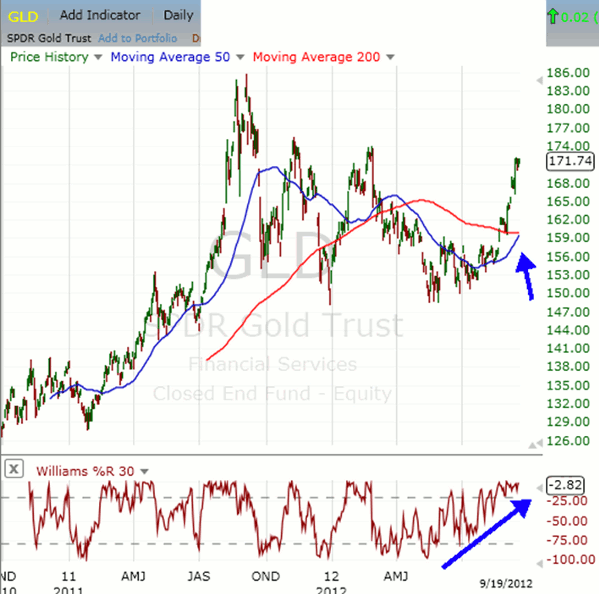
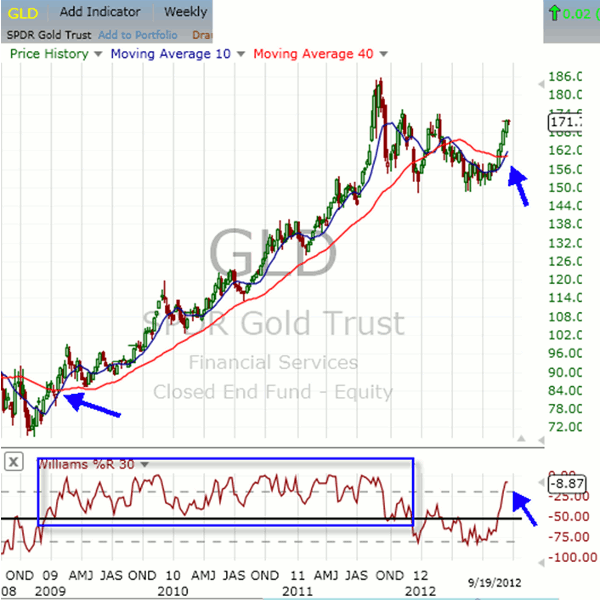
In regard to the "Golden Cross" discussed above, take a look at the daily and weekly charts of GLD seen below.
You can see on the daily chart that the crossover of the 50-/200-day simple moving averages is imminent. Also note how %R is trending higher in a manner that it hasn't throughout the whole time frame covered on this chart—pullbacks in %R should be contained around mid-levels, and may be good low-risk longside entry points.
On the weekly chart, using the ten- and 40-unit simple moving averages (roughly equivalent to 50- and 200-day), a bullish crossover is occurring this week.
There hasn't been a bullish crossover on this time frame since early 2009, which was followed by a 2.5-year rally in GLD. Also note that GLD weekly %R has peeked into bullish territory for the first time this year.
Moby Waller can be found at ETFTRADR.


