

In a previous article, Greg Harmon of Dragonfly Capital cautioned against Treasuries, and today offers further proof of the reasoning behind his caution.
US Treasury Bond prices have been the source of debate for nearly a year. When will the top form and the trade of the century unwind? It may be happening now, but then again, maybe it isn’t. Take a look at the chart of weekly bond prices below. The case for a top is made from the falling Relative Strength Index (RSI) and negative Moving Average Convergence Divergence indicator (MACD) supporting a downside move while price is at support and on the 50 week Simple Moving Average (SMA). A break under 145 would trigger a target of 135 initially. But then there is the case for a continued move higher.
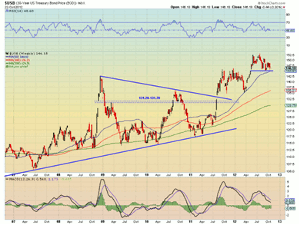
Click to Enlarge
The target for the triangle break remains higher at 161.50 and the measured move higher if it can get over 153 is just above that at 163. Plus all of the SMA are rising—the trend is still higher. The 3-box reversal Point and Figure chart offers no help as it shows the price objective at 150 met. So what do you do? The same thing you have always done, follow price action. On a move under 145 declare the trend dying, if not dead, and short it. On a move over 153 hop on board for a ride higher. And until then…watch!
By Greg Harmon of Dragonfly Capital


