There’s a specific short-term pattern that’s been occurring after every single pullback in 2015, so technician Corey Rosenbloom, of AfraidToTrade.com, takes a technical look at how this pattern has played out in the past, since it could—quite possibly—continue to do so in the future.
As traders, one of our responsibilities is to spot patterns in the market and then exploit them as long as they keep occurring.
After spotting a specific pattern, we use it to guide our trading decisions until the pattern fails and a new one emerges in its place.
There’s a specific short-term pattern that’s been occurring after every single pullback (retracement) in 2015 so let’s take a look at it, see how it played out again perfectly Wednesday, and be on guard for this pattern to stop working.
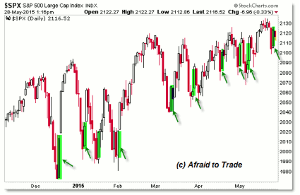
Here it is in the S&P 500:
In simplest terms, after a sell-swing (retracement) against the ongoing uptrend, buyers flood the market and boost prices sharply higher after even the slightest pullback.
This highlights bullish dominance of the market as liquidity continues to float prices higher.
Simply note the big green highlighted bars (days) after every last pullback in price.
Instead of a stable reversal (intraday) as we saw at the highs before a sell-swing, each reversal back to the upside occurred on a huge surge of buying pressure, thrusting the market straight up in a trend day; not a gentle reversal at all.
Tuesday’s trend day sell-swing down gave way to Wednesday’s even stronger trend day up.
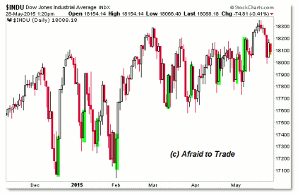
The picture is the same in the Dow Jones for reference:
We can see that after the sell-swings—every one of them—buyers spiked the market higher powerfully, turning short-sellers into buyers on the way up (as they covered losses).
While the ongoing short-term pattern may fail, it’s helpful to be aware of it and how it has played out in the recent past and may continue to do so in the future.
By Corey Rosenbloom, CMT, Trader and Blogger, AfraidToTrade.com


