
What happens after the S&P 500 bounces back from a huge correction? Rocky White breaks it down here.
Stocks have rebounded nicely since a disastrous fourth quarter in 2018. The S&P 500 Index (SPX) fell 14% in the final three months of last year. The index has made up most of that, gaining more than 12% this year, with a few more days to go in the first quarter. This week, I'll look at prior instances when the index lost double digits in one quarter just to gain double digits the next quarter, to see if the upward momentum tends to persist.
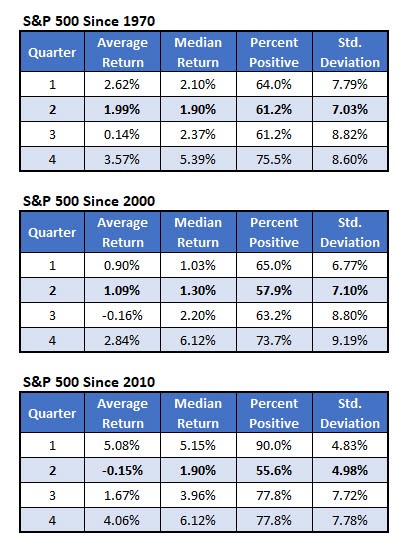
HISTORICAL S&P RETURNS BY QUARTER
First, the tables below show how the quarters have generally performed over different time periods. Going back to 1970, the second quarter has been adequate, averaging about a 2% return, and positive 61% of the time. Since 2000, the second-quarter average is the second best, after the fourth quarter, but it has been the least likely to be positive, with only 58% of the returns positive. Looking at just the bull market since 2010, the second quarter has in fact struggled. It has averaged a slight loss, with just five of nine quarters positive.
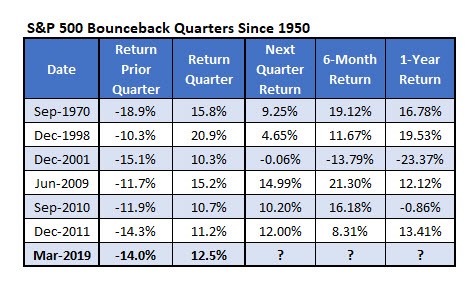
BREAKING DOWN S&P BOUNCEBACK QUARTERS
The table below shows each quarter in which the S&P 500 Index gained at least 10% after the prior quarter lost at least 10% since 1950. The momentum looks likely to continue. The three prior occurrences saw these double-digit quarters, followed by another double-digit quarter. Five of the six next quarterly returns were positive. The one time the S&P 500 fell, however, it was huge as stocks were down more than 20% a year later.
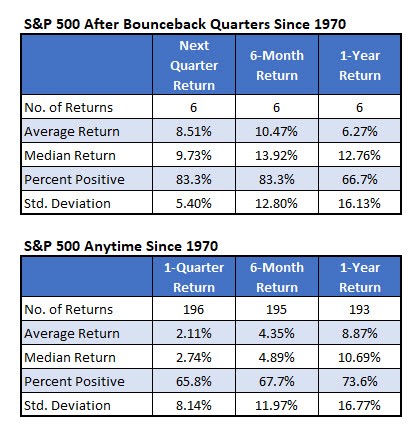
The table below summarizes the six returns after bounce-back quarters. I also show anytime returns since 1970 -- the year of the first bounce back quarter. The next quarter has tended to be very strong, averaging an 8.5% return. The return over the next two quarters also outperforms handily, averaging a 10.5% return, with five of six returns positive. The one-year returns aren't too impressive, so now might be the time to buy in.
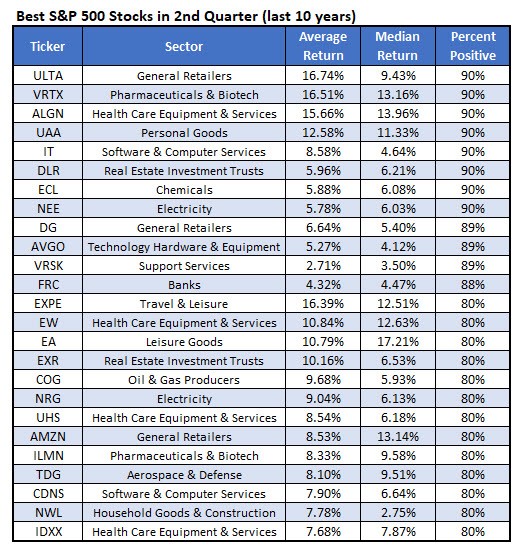
THE BEST AND WORST SECOND-QUARTER STOCKS
If you're searching for stocks to play, below is a list of S&P 500 stocks that have had positive second-quarter results over the past 10 years. It's the best 25 stocks sorted first by percent positive, and then by average return.
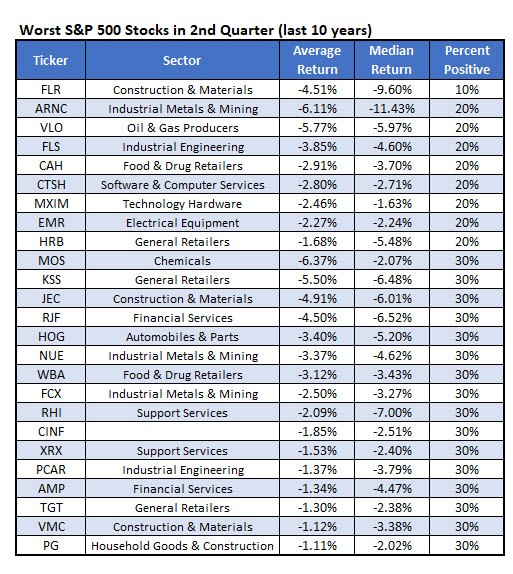
Finally, here's the list of S&P 500 stocks that have performed the worst over the past 10 years.