

A study of technical trends indicate that Wabtec Corporation may be in for a down move after failing a test of key technical levels, reports Elizabeth Harrow.
Shares of Wabtec Corporation (WAB) have recovered from their mid-August low of $61, up about 16% in the intervening weeks to trade around $71 at last check. As a result, the stock has worked off its oversold condition of less than a month ago and it's now staring down an overhead trendline that has had strongly bearish implications in the recent past, suggesting another leg lower could be imminent.
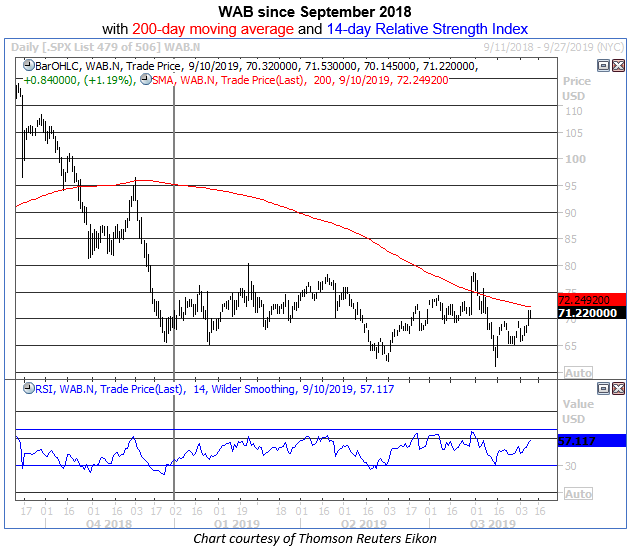
Specifically, Schaeffer's Senior Quantitative Analyst Rocky White notes that WAB is trading within one standard deviation of its 200-day moving average after a prolonged stretch beneath this benchmark trendline (see chart). Over the past three years, there have been three other occasions where WAB has tested resistance at its 200-day moving average in this manner— WAB’s five-day returns following those tests have been negative across the board, with the average return over that next trading week amounting to a drop of 5.35%.
Looking longer-term, the average 21-day return after testing resistance at its 200-day is a decline of 8.17%, with only 33% positive returns. Based on Monday's close, another average pullback from this trendline resistance would place WAB around $64.63 one month from now, in the vicinity of its year-to-date closing lows.
Since this trendline was breached last October, the equity's one significant breakout above its 200-day moving average occurred just recently, when WAB rallied in the wake of its July 30 earnings report. Despite notching a four-day streak above this trendline, the stock's positive momentum fizzled at the $78 level, which previously marked the mid-April closing high. The $78 level also marks a 23.6% Fibonacci retracement of WAB's decline from its September 2018 closing high to its Dec. 24 closing low.
And while the stock's latest rally was likely aided by short covering, with short interest down nearly 7% in the most recent reporting period, some of the more firmly entrenched bears could be encouraged by another 200-day rejection. A healthy 18.6% of the equity's float remains dedicated to short interest, and the long-term price trend suggests these bears remain firmly in control.
Those looking to bet on another leg lower for WAB should consider the stock's short-term options, which are pricing in relatively low volatility expectations, from a historical standpoint. Schaeffer's Volatility Index (SVI) arrives at 34%, in the 32nd percentile of its annual range, indicating front-month bets on the transit name have rarely been cheaper.


