

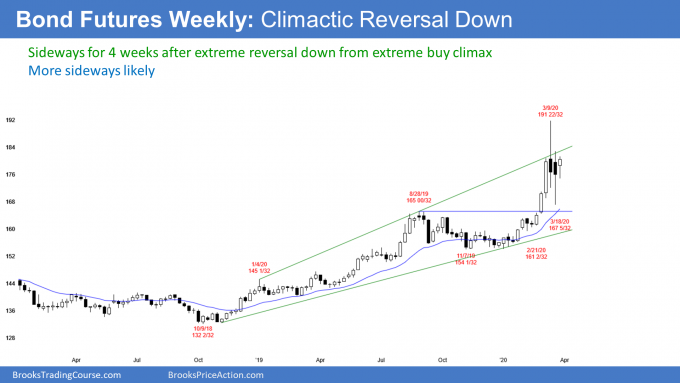
The bond futures market has begun a trading range after a strong reversal down from an extreme buy climax, reports Al Brooks.
The U.S. 30-year Treasury bond futures last week traded within the previous week’s range. It was an inside bar (see chart below). In a bull trend, that is both a buy and sell signal bar. It followed a huge reversal down from the most extreme buy climax in history.
A big move up followed by a big move down creates big confusion. A trader who is confused is confident about only one thing. That is that the market is not clearly trending up or down.
Consequently, the trader is unwilling to hold onto a long when the market is near recent highs. He is also unwilling to hold onto a short position when the market is near recent lows.
He is looking to take quick profits. That means he only wants to buy low and sell high. This creates a trading range. The weekly chart has been sideways for four weeks.
Expect a couple legs sideways to down
After a routine buy climax, traders expect a couple legs sideways to down for about 10 bars. On the weekly chart, that means two to three months.
When the buy climax is the most extreme in history, the trading range will probably last longer and be taller. The bottom of the range will probably be around 155 to 160. That was the bottom of a four-month trading range last year. Traders will assume that buyers will buy again at that level.
The reversal down from the March high was extremely fast and far. Traders will expect sellers around that level again. Consequently, the trading range will probably be from around 160 to 190.
Is a trend likely soon?
Can the three-week pullback just be another bull flag? Unlikely. When a reversal down is as strong as this one has been, there is a 70% chance of at least a small second leg down.
Can the pullback continue down and grow into a bear trend? That is also unlikely. The bull channel up from the December low was very tight. When a bull trend is that strong, the first reversal down is typically minor. A minor reversal means that it is either a bull flag or a bear leg in what will become a trading range.
Since there will probably be at least one more leg down, these three weeks have formed a weak bull flag. There will probably be more sellers than buyers above because traders expect at least as small second leg sideways to down.
The midpoint of March’s range is a magnet
There are two trading days left in March. The bond futures contract is in the middle of March’s very big range.
March will probably not close near its high or low. That makes the 179-14 midpoint important. It is more symbolic. The bulls want the month to close above the midpoint. They can then claim that they won the month. The bears want the month to close below the midpoint.
However, a close a little above or below the midpoint is much less important than the climactic reversal down from an extreme buy climax. Traders should expect the bond futures to be sideways for at least a couple months. They will look for reversals up and down every week or two.
Trading Room
Traders can see the end of the day bar-by-bar price action report by signing up for free at BrooksPriceAction.com. I talk about the detailed E-mini price action real-time throughout the day in the BrooksPriceAction.com trading room. We offer a two-day free trial.


