

Stock index bears could not maintain momentum, signaling a move to the upside, reports Ricky Wen.
Tuesday’s session played out as an upside trend day where every dip was bought as price action formed higher lows and higher highs. The context is quite clear as both bulls and bears were duking it out for the monthly and quarterly closing print. When one side loses a critical battle and keeps losing on numerous key setups, then it is what it is.
The new main takeaway from the past couple days is that the bears lost an epic battle and now the overall pattern is becoming fairly bullish given the high-level consolidation/channel on the daily and weekly charts.
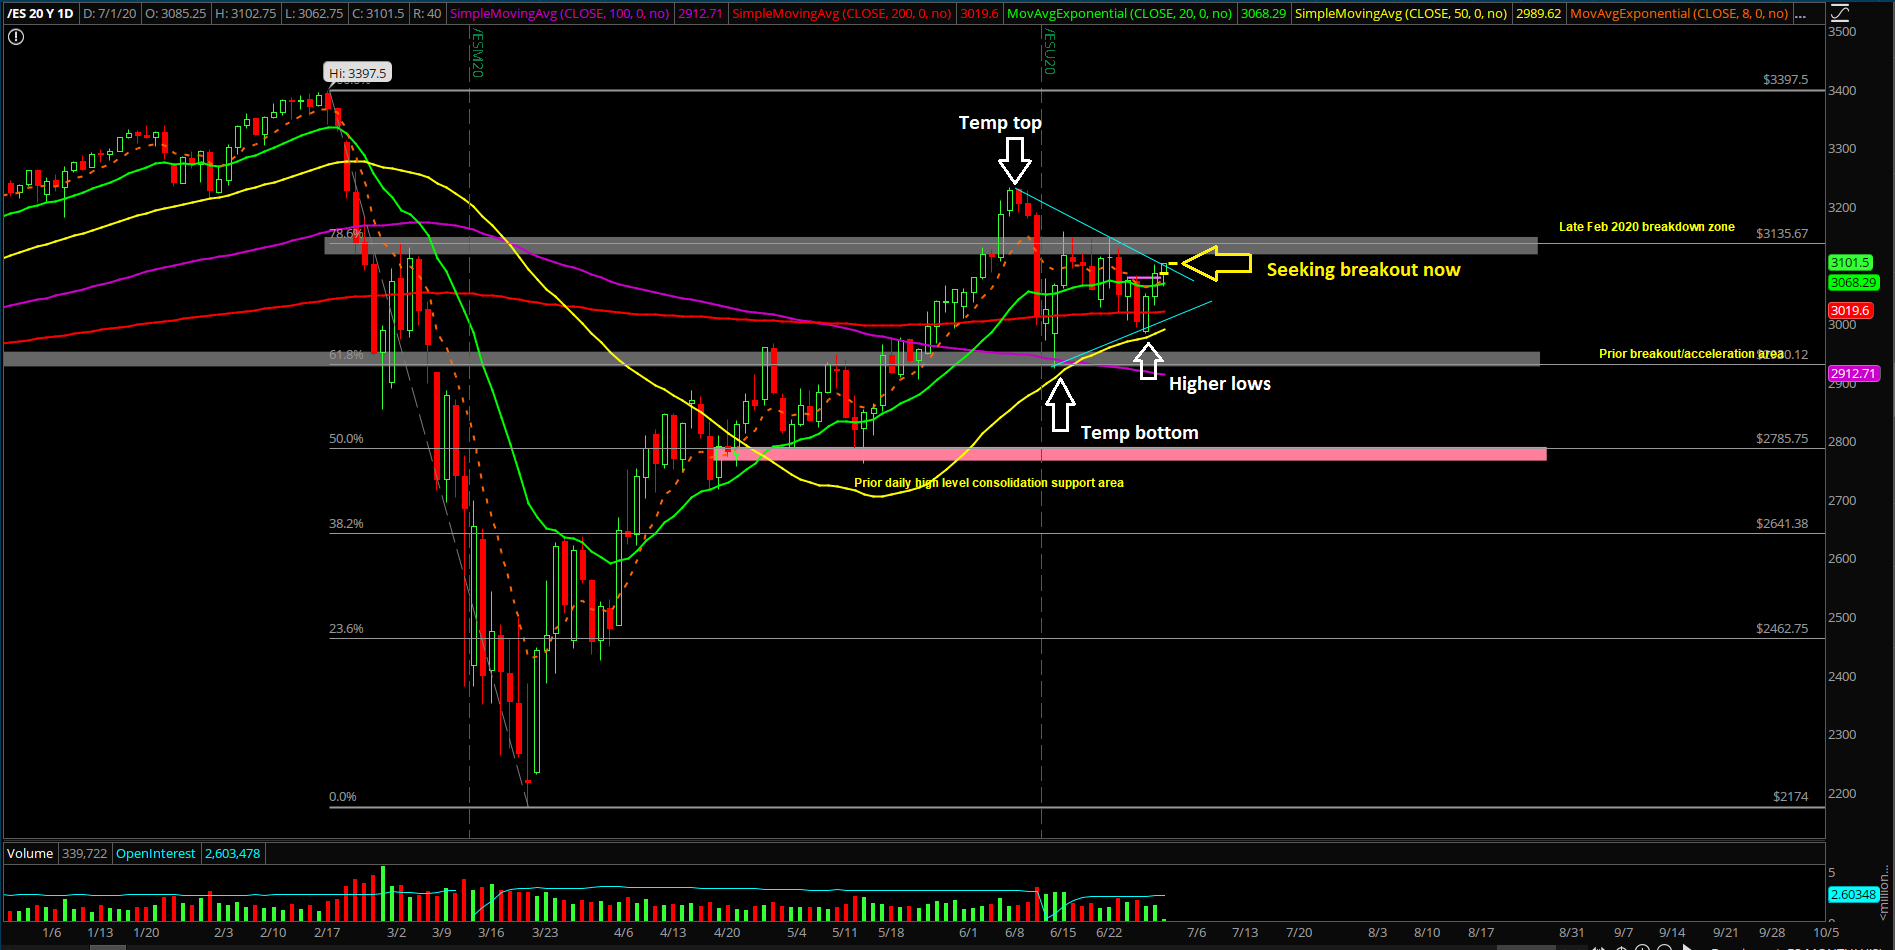
If you recall, the more time that the price action consolidates near the highs, the higher odds it gives the ongoing bulls because the gummy bears were not able to entice the real, big, bad bears to rotate come into town. If price action keeps sustaining above 3030 on the E-mini S&P 500 (ES) in the coming days, then market participants will have to be looking for an eventual breakout to the upside (see chart).
What’s next?
Tuesday closed at 3084.75 on the ES, which was slightly above the midpoint of the overall month of June’s range of 3070s. Bulls have broken back above the trending moving averages on daily chart and now just teasing in a triangle that is also within a trading channel. When one side fails a critical setup (in this case, bears), it’s time for the other side to shine to try and win it all.
Some game plan highlights:
- We are back to neutral-bullish mode for our short-term bias when above ES 3030, given the ongoing context of a bullish continuation pattern on the daily and weekly charts.
- If you recall, the bears tried their best at a breakdown continuation setup into lower lows for the past few sessions, but ultimately could not break below the June low of 2923.75. The recent low from Sunday June 28 at 2983.25 is now treated as a higher low vs the temporary bottom of 2923.75. In scenarios like these, the bulls will try their shot at the recent temporary top 3231.25 if price keeps sustaining above supports.
- Range is now 3150-2983.5 within 3231.25-2923.75.
- For reference, yesterday’s monthly and quarterly closing print favors the bullish pattern because the opposing side failed miserably on their goals.
Ricky Wen is an analyst at ElliottWaveTrader.net, where he hosts the ES Trade Alerts premium subscription service.


