

In part one and part two of this series I discussed and illustrated the relationship between small trader sentiment and market turning points, states Jake Bernstein.
The evidence strongly suggests an inverse correlation. More specifically, when small trader sentiment is in strong agreement about a pending or developing market top or market bottom the opposite usually holds true. We examined some charts that illustrated this relationship. However, as a trader my more significant interest is in finding and using leading indicators, which will give me an opportunity to prepare for a pending change in trend.
The salient feature of market sentiment using my index, the DSI, is that it has long demonstrated its ability as a leading indicator. The DSI reaches a high level prior to tops and a low level prior to bottoms. Although no indicator is perfect the DSI has racked up an impressive record as a leading indicator. The perennial challenge in using market sentiment indicators is our ability to quantify trader sentiment. Various efforts to do so have come and gone over the years. This is where the DSI excels.
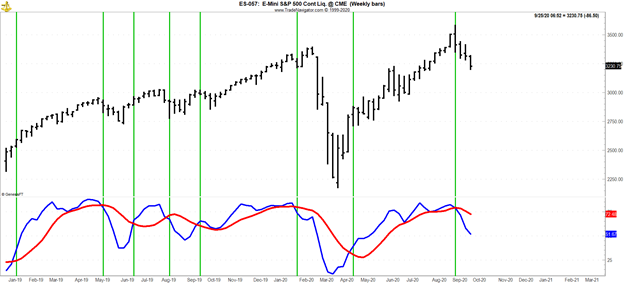
Because the DSI is expressed as a percentage of bullish opinion, a reading of 90% or higher tends to precede tops and a reading of 10% or lower tends to precede bottoms. The 90% and 10% levels are not written in stone; they can vary from market to market depending on the emotional reactivity of market participants and underlying geopolitical and fundamental influences on trader behavior. Nonetheless the DSI can be used as an indicator in traditional ways such as crossovers. Shown below you’ll see two charts using DSI as an indicator for market timing. If you have a further interest in the use of my market sentiment indicator as a timing tool please let me know and I will elaborate further: my email is Jake@trade–futures.com
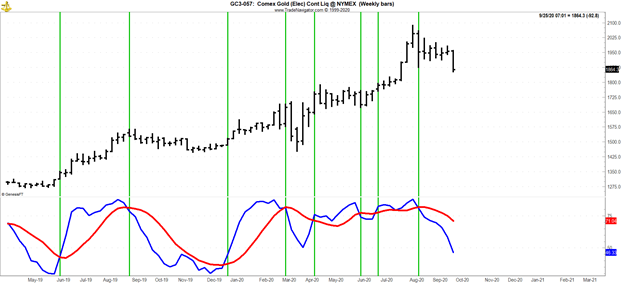
Here’s a similar chart of gold futures.
The chart above shows weekly DSI plotted against weekly S&P futures. The bottom of the chart shows a moving average of the DSI (blue line) and a moving average of the blue line. Buy and sell signals are generated on crossovers of the two moving averages. While not perfect, the signals are impressive.
To learn more about Jake Bernstein, please visit JakeBernstein.com.


