

When I look at a stock chart, I expect to see some basic patterns developing, states Bob Lang of ExplosiveOptions.net.
Some patterns play out while others morph into new ones. For example, you might see an evening star pattern forming (a bearish, three-candle move). Then a day or two of bullish action completely destroys it. Needless to say, that’s incredibly frustrating. To find reliable patterns in the technical analysis world, look to resistance and support levels.
What Are Resistance and Support Levels?
The resistance and support levels for stocks are fairly easy to identify with a marking tool. Draw a line that connects at least two to four tops (resistance) or bottoms (support). Once you do that, you can be confident that the stock price will bump up against resistance or fail to drop below support. This is illustrated in the chart below.
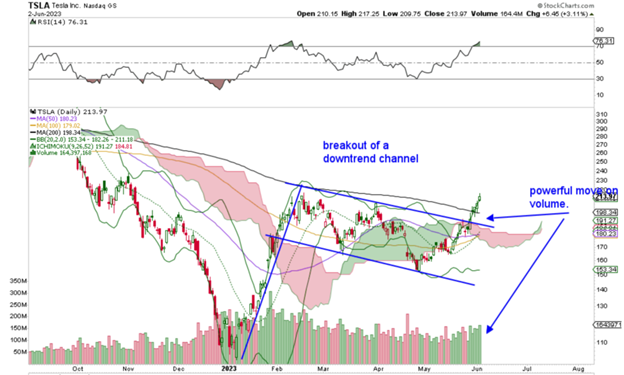
Resistance and support levels can be bullish, bearish, or neutral. A trendline of higher highs and higher lows is a bullish support pattern. This tells us when the price level tags these trendlines, the odds favor a move back down. When a channel is created, which you can see in the above chart, there’s more room for the stock to maneuver and a defined breakout will be even more visible. Big institutions use these breakouts to add or subtract stocks from their portfolios (no, it is not always about fundamentals!).
Use the Trendlines to Guide Your Trading
If you draw a resistance line and the price level of a stock you own meets those levels, you want to take money off the table and wait for the stock to come back down. Do the opposite for support. When a stock tags a lower trendline, you want to start adding to your position. Pay close attention when a resistance or support trendline is broken. This is when big surges in price (up or down) often occur.
Now, clearly, this is not scientific. It requires confidence, the ability to recognize patterns, and a belief that patterns repeat themselves. Trendline creation is subject to theoretical analysis, and not everyone sees it the same way. Anticipating where the current price levels are going is not easy. Nothing works 100% of the time, but if you put the best odds in your favor, it could work to your advantage.
Learn more about Bob Lang at ExplosiveOptions.net.


