

The Chart of the Day belongs to the industrial technology company Crane NXT (CXT), states Jim Van Meerten of BarChart.com.
I found the stock by using Barchart's powerful screening functions to find stocks with the highest technical buy signals, highest Weighted Alpha, superior current momentum, and a Trend Seeker buy signal, I then used the Flipchart feature to review the charts for consistent price appreciation. Since the Trend Seeker signaled a buy on 4/6 the stock gained 47.36%.
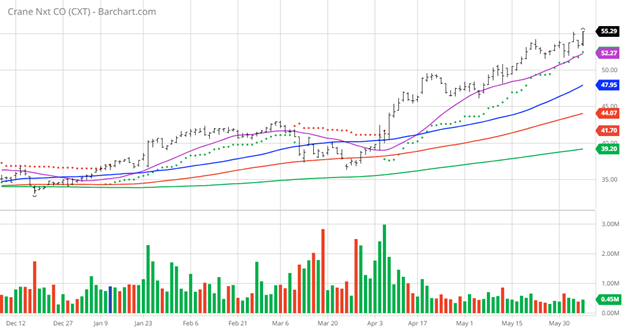
CXT Price vs Daily Moving Averages
Crane NXT, Co. focuses on payment and merchandising technologies. It indents to offer electronic equipment and associated software leveraging extensive, and proprietary core capabilities, including payment verification and authentication, as well as automation solutions, field service solutions, remote diagnostics, and productivity-enhancing software solutions. The company is based in Stamford, Connecticut.
Barchart's Opinion Trading systems are listed below. Please note that the Barchart Opinion indicators are updated live during the session every 20 minutes and can therefore change during the day as the market fluctuates. The indicator numbers shown below therefore may not match what you see live on the Barchart.com website when you read this report.
Barchart Technical Indicators:
- 100% technical buy signals
- 86.50+Weighted Alpha
- 64.35% gain in the last year
- Trend Seeker buy signal
- Above its 20, 50, and 100-day moving averages
- 11 new highs and up 15.33% in the last month
- Relative Strength Index 67.17
- The technical support level at $53.96
- Recently traded at $55.29 with a 50-day moving average of $47.95
Fundamental Factors:
- Market Cap $3.03 billion
- P/E 8.01
- Dividend yield 1.02%
- Revenue is projected to grow 35.20% next year
- Earnings are estimated to increase 39.90% next year and continue to compound at an annual rate of 7.40% for the next five years
Analysts and Investor Sentiment: I don't buy stocks because everyone else is buying but I do realize that if major firms and investors are dumping a stock it's hard to make money swimming against the tide:
- Wall Street analysts gave two strong buy, two buy, and two hold opinions on the stock
- Analysts' price targets are between $67 and $140 with a consensus of 69.50 for a 25.70% gain
- The individual investors on Motley Fool have not discovered this stock yet
- Only 214 investors monitor the stock on Seeking Alpha
Disclosure: I/we have no stock, option, or similar derivative position in any of the companies mentioned, but may initiate a beneficial Long position through a purchase of the stock, or the purchase of call options or similar derivatives in the next 72 hours.
Additional disclosure: The Barchart Chart of the Day highlights stocks that are experiencing exceptional current price appreciation. They are not intended to buy recommendations as these stocks are extremely volatile and speculative. Should you decide to add one of these stocks to your investment portfolio it is highly suggested you follow a predetermined diversification and moving stop loss discipline that is consistent with your personal investment risk tolerance and reevaluate your stop losses at least on a weekly basis.
Learn more about Jim Van Meerten at BarChart.com.


