

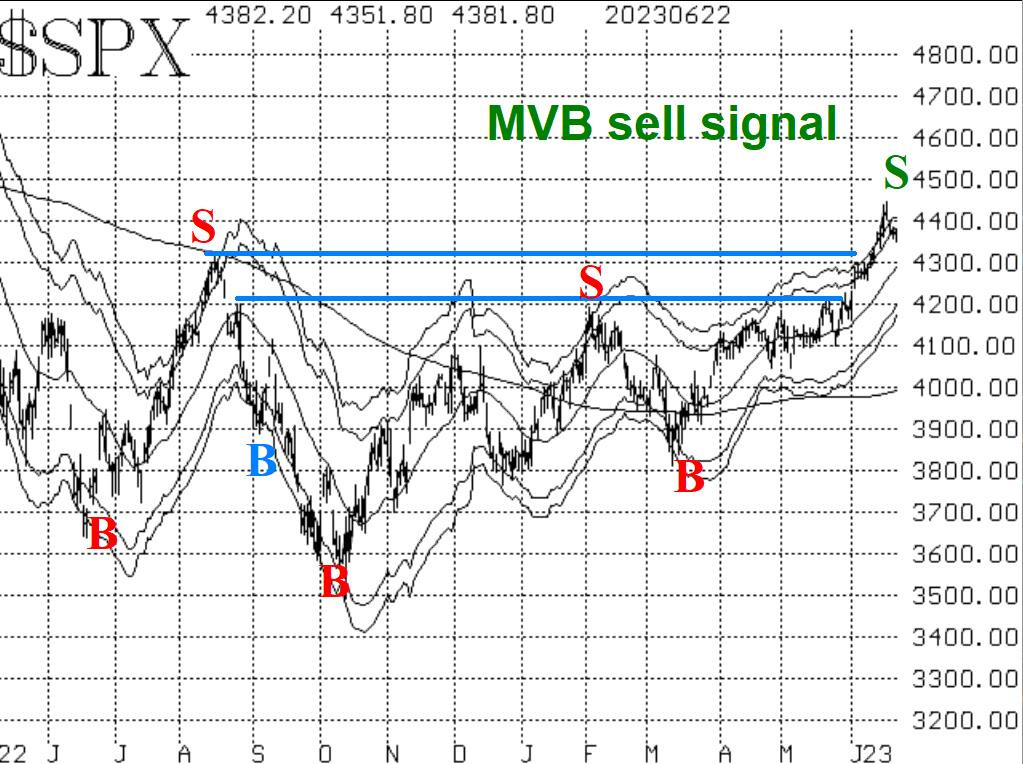
When the S&P 500 (SPX) broke out over 4300 back on June ninth, a strong rally was unleashed, says Lawrence McMillan of Option Strategist.
Perhaps that rally got carried away, as several indicators moved into overbought territory, and the Index itself traded above its +4sigma "modified Bollinger Band" (mBB). That exhausted a lot of buying power it seems, and now the Index is pulling back.
There is still support at both 4300 and 4200 on the SPX chart. A decline below 4200 would be quite negative and would indicate that perhaps the whole upside breakout was a false move. Otherwise, any pullback towards those support levels can be thought of as a normal pullback after a breakout.
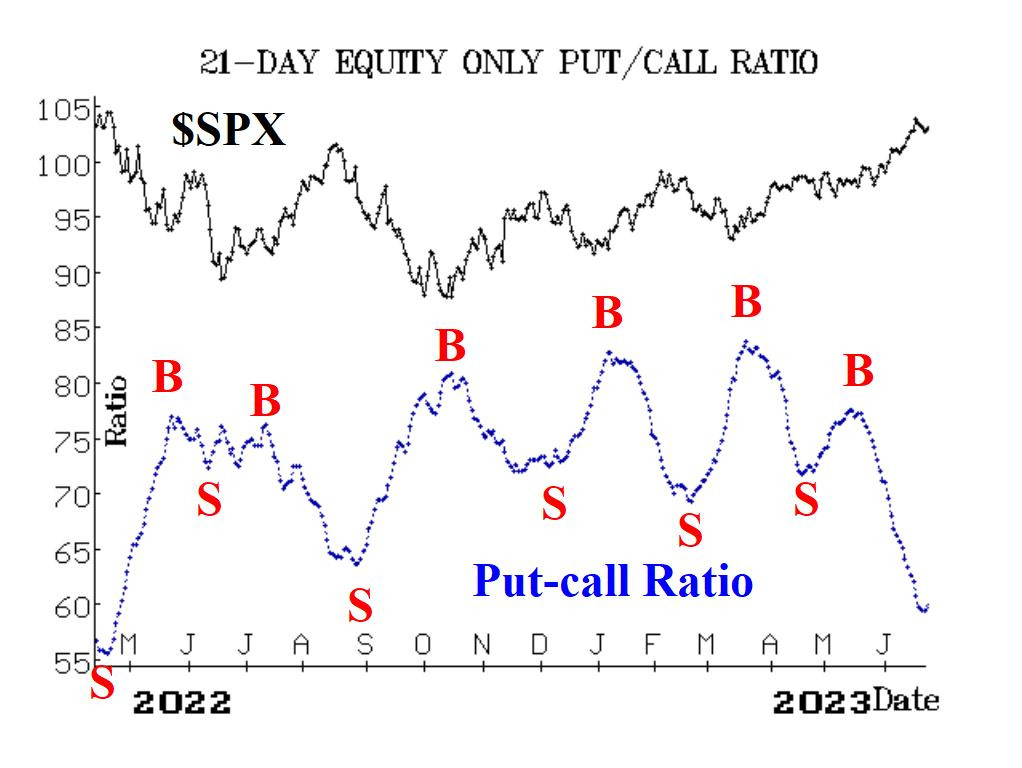
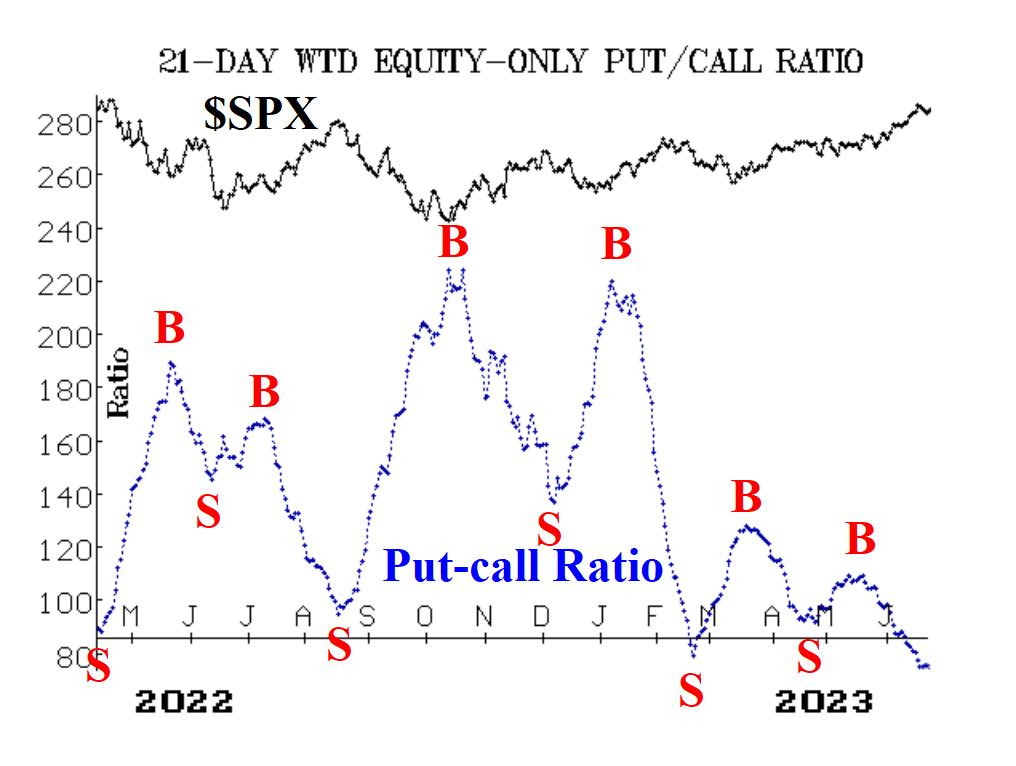
Equity-only put-call ratios are quite overbought but have not yet generated sell signals. One can see from the graphs in Figures Two and Three that the ratios have curled upward a little bit in the last day or two, but that is not enough to say they are rising. They will remain on buy signals until they roll over and begin to trend higher. But the fact that they are so low on their charts indicates that they are overbought, and they are near the areas from which sell signals have emanated in the last couple of years.
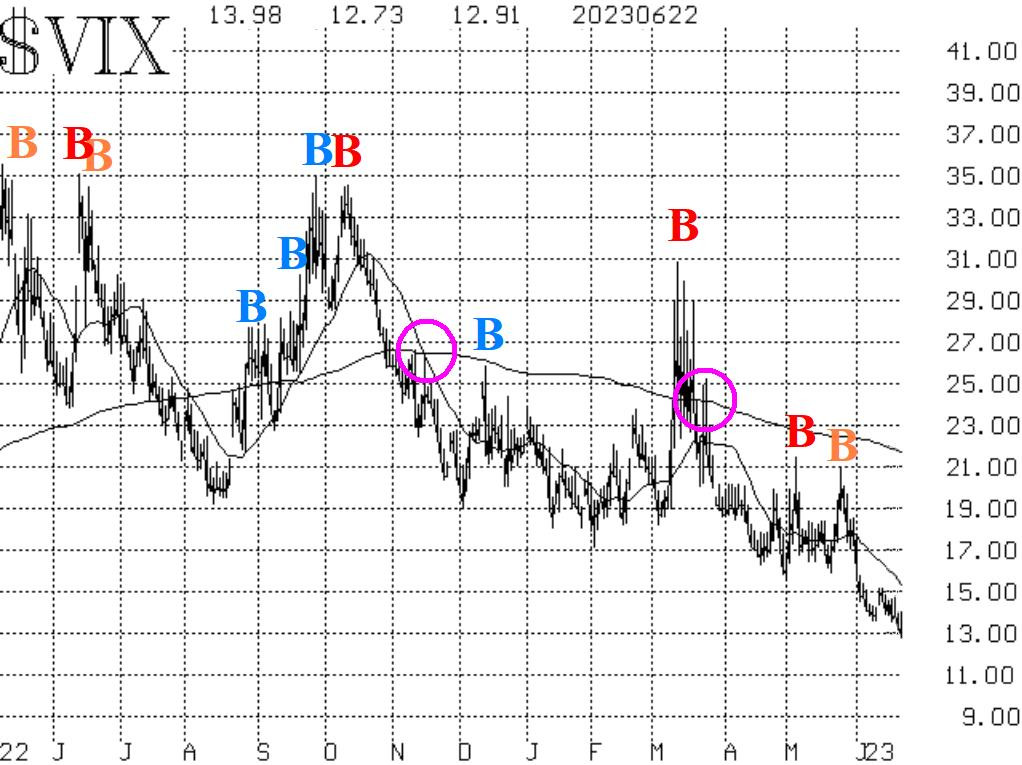
Breadth has been terrible this week. That has canceled out the previous breadth oscillator buy signals and instead generated breadth oscillator sell signals. The Cboe SPX Volatility Index (VIX) has been oblivious to any bearish thoughts. The Index has continued to fall to new relative lows—now falling below 13 for the first time since January 2020. Thus, the trend of the VIX buy signal remains in place. Some might consider VIX "overbought" at these levels, but even so, that is not a problem until VIX begins to rise.
In summary, we are maintaining a "core" bullish position because of the positive nature of the SPX chart. We will trade other indicators' signals around that core position.


