

On Monday, crude oil tumbled and Treasury yields fell for a second consecutive day – but that wasn't enough to lift the major indices. It may be the safest choice to simply follow trends, price, volume, and market reaction to news. The Invesco QQQ Trust (QQQ) is a great current example of why, advises John Eade, president of Argus Research.
Large- and mega-cap semiconductors dragged on the big-cap indices earlier this week. On Monday, Nvidia Corp. (NVDA) and Advanced Micro Devices Inc. (AMD) fell 5%, while Sandisk Corp. (SNDK) plummeted 11%.
Invesco QQQ Trust (QQQ)
Data by YCharts
The fascinating part of stock-market analysis is that even though everyone has the same information, interpretations and opinions run from A to Z. An old joke suggests that if you put 10 economists in a room, you'll end up with 10 different opinions.
Likewise, interpretations of a chart can run the gamut from super bearish to super bullish. Analysis is full of biases, and subjectivity is a very common fault among analysts.
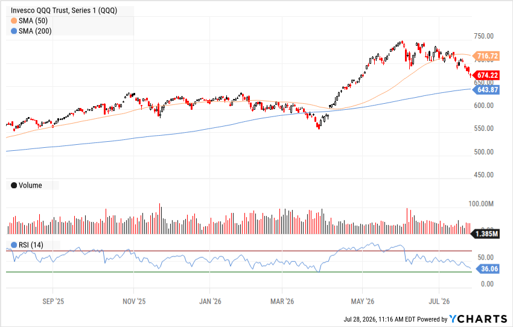
On the QQQ daily chart, one could make the argument that price has broken down from a triangle as well as a rare diamond top. But one could also claim a normal consolidation is working off some overheated momentum and cooling some of the semi names.
On the weekly chart, a perfectly fine conclusion is that the ETF is tracing out a bullish flag back to its 21-week exponential moving average – and that we are close to embarking on the next leg up. One undeniable fact is that volume during this decline is much lighter than during the decline just a few months, a bullish sign.