

Who’s going to win the performance race in 2026 – the US or Canada? My podcast guests chimed in last week – but let’s see what the charts and the data say.
This MoneyShow Chart of the Day compares the year-to-date performance of the iShares MSCI Canada ETF (EWC) and the iShares Core S&P 500 ETF (IVV). You can see that as of late last week, our Canadian fund (in red) had a slight lead over our US competitor (in blue) – 15.1% vs. 13.9%. While I’m not showing it here, secondary indicators like RSI and MACD also look stronger with EWC than they do with IVV.
EWC Vs. IVV (YTD % Change)
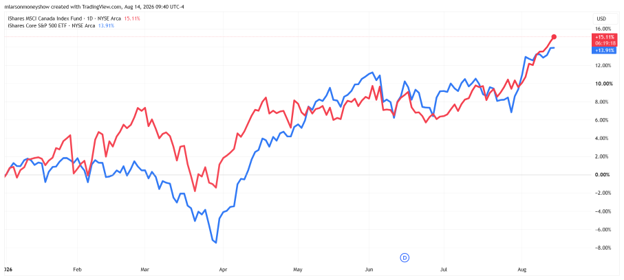
Source: TradingView
In last week’s MoneyShow MoneyMasters Podcast, my guests Tom Bruni and Sid Mokhtari covered some of the reasons for the divergence – and their thoughts on where both markets will head next. Now, I want to highlight the stocks and sectors each fund favors here.
The EWC’s biggest sector weighting is financials at 40.2%. The IVV’s is technology at 37.6%. Energy stocks account for 16.8% of the EWC and materials are good for another 14.5%. In the IVV, those sectors represent just 3.2% and 1.7%.
In terms of individual names, EWC’s top two holdings are Royal Bank of Canada (RY) and Toronto Dominion Bank (TD). IVV’s are Nvidia Corp. (NVDA) and Apple Inc. (AAPL). The biggest bank stock in IVV is JPMorgan Chase & Co. (JPM)…but it’s only the fund’s 10th largest holding. The only tech stock in the top 10 for EWC is Shopify Inc. (SHOP); it has a 6% weighting.
Bottom line? The choice of where to invest boils down to how you think sector leadership will shake out. If you think tech is the place to be, you’re better off overweighting US ETFs like IVV. If you think financials, materials, and energy are on the march, you’re better off focusing on Canadian funds like EWC.
Personally, I’ve staked out a case for investing more heavily in foreign markets and sectors where capital is rotating. It’s working out so far – though we still have more than four months to go in 2026!