

What will it take to break the stalemate in the Middle East...and the oil markets? While investors ponder those questions, keep an eye on the charts.
The MoneyShow Chart of the Day shows the progression of WTI crude oil futures since the start of the year. You can see the big run up when fighting broke out, followed by the post-MOU pullback in June. Prices rose again in July, but they’ve mostly been chopping around since then.
Crude Oil Futures
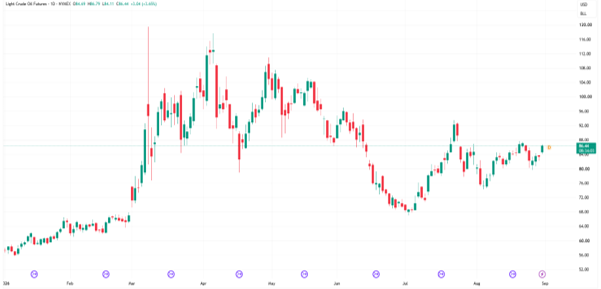
Source: TradingView
It’s a tense situation to say the least. The outlook for inflation and growth hinges largely on whether oil breaks out...or breaks down.
To the upside, I’d keep a close eye on the $87 level in the short term and $92.50 in the intermediate term. To the downside, my key levels are $80, then $74.50. They’ll tell you whether the bulls or the bears are gaining the upper hand amid conflicting headlines out of the Middle East.