

The S&P 500 Index (^SPX) recently pulled back to 7,611 – chart support from the early June closing high. The index also almost fell to the 10-week exponential moving average (EMA). Focus on attractive trading opportunities here, like Albemarle Corp. (ALB), advises John Eade, president of Argus Research.
There was a minor bearish crossover in the SPX from the 5-day/13-day EMA and the 21-day rate-of-change (ROC) is close to negative territory. But the rising 50-day average, as well as chart support from the highs in the first half of July, come in between 7,571 and 7,580.
Here is an important question: Is this just a normal test of a key breakout region or something more? Failed breakouts generally lead to at least short-term trouble and can correct back to the low of the range, which in this case is in the 7,250 to low-7,300 zone.
Albermarle Corp. (ALB)
Source: TradingView
As for ALB, it’s a global maker of highly engineered specialty chemicals for a wide range of markets. It is a top maker of lithium, used in a number of industries but particularly for batteries in EVs. Another leading product is bromine, used in fire safety solutions.
ALB had a nice run from its 2009 low of $16 to its November 2022 peak of $335, although the road was quite bumpy. The stock then collapsed to $50 by April 2025, matching its prior low from March 2020.
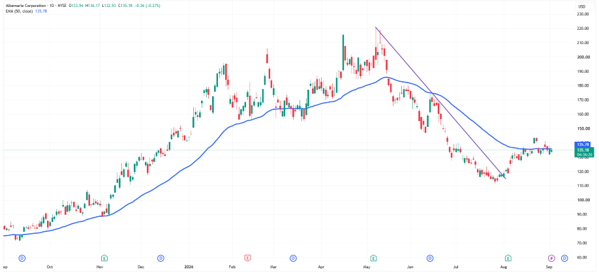
The shares then ran sharply higher until May 2026, retracing 61.8% of their bear market and with some evidence of accumulation during the rally. ALB then retraced 61.8% of the advance and tested its latest breakout in the $115 region.
Price has bounced since late July and has taken out its downtrend line off the peak. This is an oversold candidate and one that has shown signs of bottoming. We would put a stop-loss just under chart support at $125. We would take some profits at resistance that kicks in at $150, with the potential for more gains over the long term.