

Semiconductor stocks are critical market bellwethers, ones I’ve been following closely for months. They showed progress this week. But some key technical levels still bear watching!
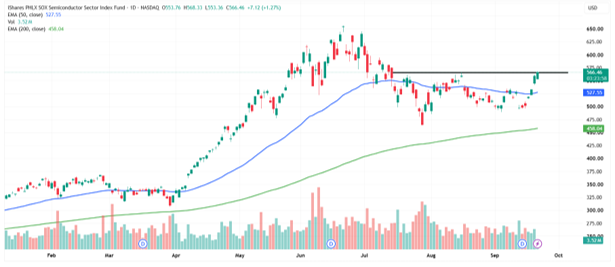
Check out my MoneyShow Chart of the Day here. It shows the iShares Semiconductor ETF (SOXX), along with the 50-day and 200-day Exponential Moving Averages in blue and green, respectively.
iShares Semiconductor ETF (SOXX)
Source: TradingView
On the encouraging side of things, volume was extraordinarily high on that “flush” we saw in late July. The SOXX then made a couple of higher lows in September, with buyers showing modest enthusiasm, and it recaptured the 50-day EMA.
But now, the SOXX is facing overhead resistance at the original breakdown level from July. Some individual chip names like Advanced Micro Devices Inc. (AMD) have passed their technical tests. Will the broader sector?
We don’t know...yet. If you’re the kind of trader who wants confirmation before jumping in too aggressively, wait to see if SOXX can clear the $568-$575 area.
Keep an eye on the Invesco QQQ Trust (QQQ) while you’re at it. If the chips can take out resistance, chances are it’ll make a convincing new high as well – setting the stage for a nice year-end rally.