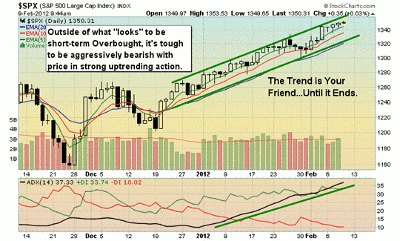
Briefing.com writes that with “golden crosses” evident on the charts for major averages and high-volume breakouts happening with regularity, those who question the rally shouldn’t trade aggressively against it.
I recently wrote about the "golden cross" pattern (50-day moving average crossing back above its 200-day moving average) occurring on the S&P. Both the Dow Jones Industrials and the Nasdaq 100 had flashed this bullish signal back in early January and December, respectively. The Russell small caps and Nasdaq Composite were lagging but on the move.
As this strong bullish uptrend remains in effect, we know have the Russell and Nasdaq "catching up," as they too have recently signaled golden crosses. According to my charts, the S&P midcaps are just about to signal as well. Only the NYSE Composite Index appears to be lagging more so.
See related: Golden Cross: Reliable in Any Market
So what’s that mean? Golden crosses have a tendency to reflect a longer-term bullish environment for stocks, however, in my experience, there can be a shorter-term bearish correction soon after.
This correction is what I refer to as a "snapback," because of the lagging nature of moving averages. More often than not, when a moving average crosses over another, price itself is already extended in a strong directional move, and is poised for some sort of corrective/consolidation action.
Now that the majority of the major indices (SPX, Dow, Nasdaq 100, Nasdaq Composite, and Russell) have all signaled golden crosses, I’d suspect this uptrend starts to subside here in mid-February.
As of last week, the SPX closed at almost +6% above its 50-day simple moving average; not a "hard" sell signal by any means, but historically, a sign that the market is overbought and ripe for some sort of correction/consolidation phase.
There are 169 stocks in the S&P 500 that are up more than 10% since Jan. 1, 2012, while 47 are up more than 20%. The biggest gainers in the S&P 500 with returns greater than 35% since Jan. 1 include Bank of America (BAC), Eastman Chemical (EMN), Netflix (NFLX), Sears Holding Corporation (SHLD), Textron (TXT), and Whirlpool Corp. (WHR).
It’s also interesting to note that these largest gainers are all coming off destroyed/weak chart patterns during the latter half of 2011.
Bottom line is that the market is strong and stocks are acting great, as there are numerous uptrends in effect along with breakouts on heavy volume. That type of action would have me believe that the 2011 peaks of 1356 (July) and 1370 (May) will likely be challenged at some point during the next few weeks.
There’s no reason to expect or anticipate any sort of major correction until we start to see some heavy distribution days take hold, sending the SPX back below its rising 20-day exponential moving average (1318) for starters.
Fibonacci and Gann lovers may want to note that from a time perspective, we are looking at approximately 89 days off the Oct. low, 36 (a natural square of 6 x 6) days from the December low, and about 52 off the late-November low (55 being a Fib #), so overall, there’s some confluence here the next few days.
I believe we are also near a full moon, for what it’s worth.
By the Staff at Briefing.com


