Goldman Sachs economist Jim O’Neill, who coined the term “BRICs” about ten years ago to describe emerging giants Brazil, Russia, India, and China, recently came up with a new grouping of countries that he thinks have the best large emerging economies. The “MIST” countries (Mexico, Indonesia, South Korea, and Turkey) are not meant to replace the BRIC countries, which I recently reviewed from a technical standpoint (see The Two Best BRICs). So what about the charts of the MIST country ETFs, and should you be buying, selling, or waiting?
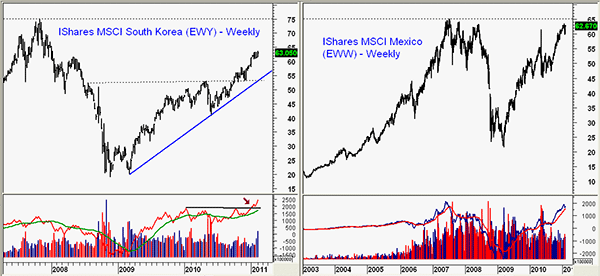
iShares MSCI South Korea (EWY) and iShares MSCI Mexico (EWW) have the strongest charts of the four MIST countries as they are both up sharply over the past few months.
Chart Analysis: EWY has traded in a narrow range for the past five weeks with support at $60.70 and resistance in the $63.70-$64 area.
- The next band of resistance is at $65-$67.70 with the all-time highs at $75
- The weekly on-balance volume (OBV) has staged a major breakout and is well above the 2008 highs
- Intermediate-term support is in the $56-$58.50 area
- Daily chart suggests a continuation pattern
EWW is already very close to its 2008 highs in the $65 area as it has had a nice move from the May 2010 lows at $45.
- The sharp drop in world equity prices took EWW briefly below $60 last week
- From the recent highs at $63.46, the 38.2% retracement support is at $57.35 with the 50% support level at $55.43
- The weekly OBV is trying to turn up from its weighted moving average (WMA) and did confirm the recent highs.
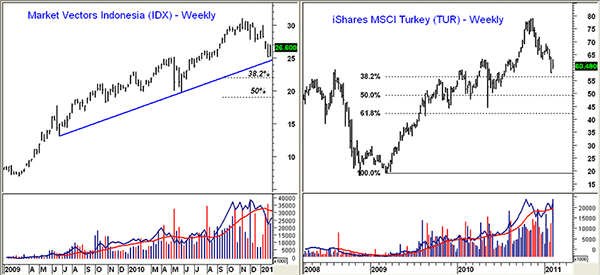
Market Vectors Indonesia (IDX) is more liquid than the iShares MSCI Indonesia (EIDO) but both have corrected sharply from the October 2010 highs.
- The weekly uptrend in the $25 area has now been reached with the 38.2% support at $22 and the 50% support at $19
- The weekly OBV did confirm the highs in IDX, but it is below its WMA and declining
- This suggests that the correction in IDX is not over
- There is initial resistance at $27.40 with stronger resistance at $30
iShares MSCI Turkey (TUR) has corrected sharply from the highs at $78.77 and had heavy volume on Thursday when TUR did close lower.
- The major 38.2% support stands at $56.50 (the recent low was $57.80) with the 50% support in the $49 area
- If TUR closes higher this week, the weekly OBV will improve, but the daily OBV is still negative
- There is initial resistance at $63 with stronger resistance at $67-$69
What It Means: Clearly, looking at the four MIST countries, there is a very mixed technical picture. Both EWY and EWW look strong but have already had nice moves recently. IDX and TUR should present good buying opportunities in 2011, but there are no clear signs yet that their corrections have been completed.
How to Profit: Of the two strongest markets, South Korea and ETF EWY look the best from a technical and risk/reward perspective. Traders should look to buy EWY at $61.56-$61.88 with a stop at $59.88. No recommendation in EWW or IDX for now.
On December 27, I advised buying TUR at $62.20 or better with a stop at $57.87 as TUR had closed at $66.04. This would not have been filled until the opening on January 28 at $60.54 and was stopped out the same day at $57.87. I will continue to monitor TUR for signs of a bottom.
Tom Aspray, professional trader and analyst, serves as senior editor for MoneyShow.com. The views expressed here are his own.


