Sharp recent gains for fertilizer stocks may mark the beginning of a new uptrend, and investors who act now can get solid entry points on three industry leaders.
Thursday’s USDA crop report hit the commodity pits hard, with corn surging to a new all-time high of $7.90 per bushel. To put this in perspective, last July, corn hit a low of $3.24 per bushel. The expected year-end corn inventories for next year dropped 22%.
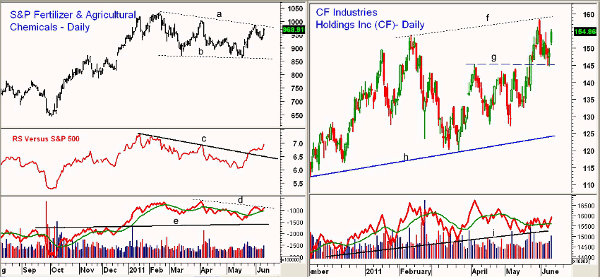
The agricultural stocks were some of the biggest gainers in Thursday’s market rebound. The S&P Fertilizer & Agricultural Chemical Index peaked in February and has since been in a downward-sloping trading channel. It has been showing better relative performance than the S&P 500 since mid-May, as it is up 11.1% versus a 2.9% decline for the S&P 500.
The higher close on Thursday improved the short-term outlook for stocks, as the McClellan Oscillator, a short-term Advance/Decline (A/D) indicator, has turned up from -194 and is now at -72. There is, however, no clear evidence that the correction form the early-May highs is over. The intermediate-term analysis is still positive despite the 6.7% correction in the S&P 500.
Normally, I try to avoid stocks in the news, as I try to spot them before they show up on Wall Street’s radar. Occasionally, just one day’s trading is enough to indicate that a correction is over, and this is the case for three of the best-known fertilizer stocks.
Chart Analysis: The continuation pattern on the S&P Fertilizer and Agricultural Chemical Index, lines a and b, should be resolved by early next week.
- The trading range has upside targets in the 1020 area with long-term resistance in the 1080-1100 area
- The relative performance (RS) broke through its downtrend, line c, in late May and has now turned up sharply. It is leading prices higher, just as it forecasted a sharp plunge in stocks like Bank of America (BAC) early in the year
- The on-balance volume (OBV) has turned up from its weighted moving average (WMA) and looks ready to overcome resistance at line b. The OBV has good support at line e.
- The weekly OBV (not shown) is acting stronger than prices
- The recent pullback to 927 held above the short-term 50% support
The best-performing fertilizer stock over the past year has been CF Industries Holdings (CF), which is a US-based, $9 billion fertilizer company that I first discussed in March (see “Fertilizer Stocks with Growth Potential”). Though some of the better-known members of the fertilizer group have corrected sharply from the highs made early in the year, CF made a new high in late May.
- The strong close Thursday on good volume suggests a move through the daily chart resistance in the $159.40 area (line f)
- A completion of the trading range, lines f and h, has upside targets in the $180-$186 area
- The pullback this week held the support from the April-to-May highs, line g, in the $145 area
- The daily OBV has turned up from support and is above its weighted moving average. The weekly OBV (not shown) continues to make new highs.
NEXT: Short-Term Buy Set-Ups for Other Industry Leaders
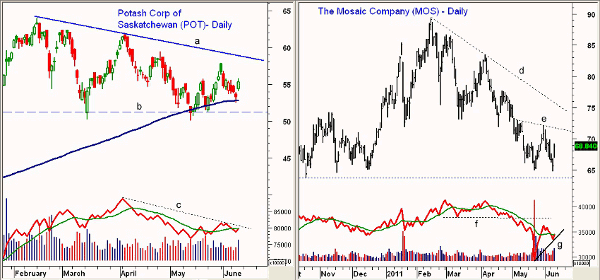
|pagebreak|Potash Corporation of Saskatchewan (POT) peaked in February at $63.96 and had a low in May of $50.09, which tested last summer’s highs, line b, and the 38.2% support level.
- POT has been holding above the gradually rising 200-day moving average (MA)
- There is short-term support now at $52.55, which was Wednesday’s low
- The daily OBV closed back above its weighted moving average on Thursday as the volume was the highest of the past two weeks. It is not far below its downtrend, line c
- The weekly OBV (not shown) did confirm the February highs
- There is first resistance at $57.86 with the downtrend, line a, at $58.80. There is stronger resistance now at $61.80-$62.20
The Mosaic Company (MOS) has had the deepest correction, as it peaked at $89.24 but is still holding above the 50% support level at $63.80.
- The daily chart shows that MOS made a lower low on Wednesday at $64.74, but the daily OBV has formed a bullish divergence, line g. A move in the OBV above resistance at line f would be positive
- There is next chart resistance at $72 (line e) with the daily downtrend at $75.50
- The major 61.8% retracement resistance is in the $80 area.
What It Means: The much stronger relative performance of the fertilizer group suggests that Thursday’s sharp gains could mark the start of a new uptrend. This would have strong implications for many markets, and possibly the overall economy as well.
For those with a relatively light exposure to the equity markets, these three fertilizer stocks look attractive, but Wednesday’s lows must hold.
From the daily chart formation, a slight pullback into Thursday’s range should provide a reasonable risk entry. If instead the stocks gap higher, we will have to wait for a pullback from stronger resistance.
How to Profit: From my March 22 recommendation, readers should be long CF at $122-$123.58, and those buyers should have sold half of that long position on March 31 at $138.77. The stop at $127.17 just held on May 5, as the low was $127.29. Raise the stop to $132.18 at this time.
The following recommendations are active only through Monday, June 13:
Those who are not long already should buy CF Industries Holdings (CF) at $153.44 with a stop at $143.66 (risk of approx. 6.3%). On a move above $158.20, raise the stop to $150.44 and sell half the position at $161.16.
Buy Potash Corporation of Saskatchewan (POT) at $54.96 with a stop at $52.32 (risk of approx. 4.8%). On a move above $58, raise the stop to $53.96 and sell half the position at $59.44.
Buy The Mosaic Company (MOS) at $68.36 with a stop at $64.48 (risk of approx. 5.6%). On a move above $72.60, raise the stop to $66.82 and sell half the position at $75.24.


