Investors favored brewers like Anheuser-Busch and others for their relative safety and yields in a tough market, but the group is technically weak, suggesting that shareholders may soon feel like drowning their sorrows.
As part of my nightly review of the day’s market action, I generally review over 150 different charts, which always includes looking for unusual volume patterns. On Tuesday (July 12), the volume in Anheuser-Busch InBev (BUD) was four times larger than normal, and Monday’s volume was also quite high.
After looking at the chart for BUD, I moved on to the chart for the S&P 500 Brewers index, as well as those of all of the large brewers. I wanted to determine if the action in BUD was an isolated event or part of an industry-wide pattern.
The stocks of the beer companies like BUD have recently been touted for their attractive dividends, with industry leader Companhia de Bebidas das Americas (ABV), better known as Ambev, a Brazilian brewery giant, yielding over 4%. Though the chart of ABV looks the strongest of the group, the other major beer company stocks look vulnerable to at least a 5% decline. That would make those yields much less attractive.
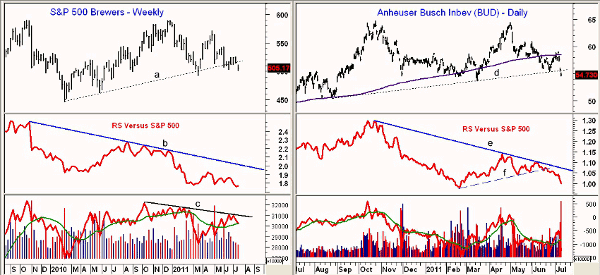
Chart Analysis: The weekly chart of the S&P 500 Brewers index shows that the group has violated the June lows with next key support at 491 and the March lows.
- The break of the uptrend, line a, which goes back to early 2010, allows for a drop to the major support in the 445-460 area. This would mean a decline of 9%-11.8% from current levels
- Relative performance, or RS analysis, shows a well-established downtrend that goes back to the fall of 2009. This indicates that this group has been weaker than the S&P 500 for the past 21 months! The RS has just made another new low
- Weekly on-balance volume (OBV) could close below its rising weighted moving average (WMA) this week. The OBV needs to move above the downtrend (line c) to turn positive. The daily OBV (not shown) is slightly positive
- The Brewers index has near-term resistance at 526 and then in the 544 area
Anheuser-Busch InBev (BUD) has gapped lower over the past two days, as the daily support at line d was broken. There is next minor support at $53.60 with the weekly Starc- band at $51.45. There is more important support in the $50.60 area.
- The daily RS line violated support on June 16 when BUD closed below the 200-day moving average (MA). It has dropped sharply over the past few days
- High volume over the past two days has pushed the daily OBV below its weighted moving average. The weekly OBV (not shown) looks more negative and has already broken support
- There is initial resistance for BUD at $58.44 and the flat 200-day MA. Further resistance is in the $60-$61 area
NEXT: Latest Charts for Molson Coors and Emerging Giant Ambev
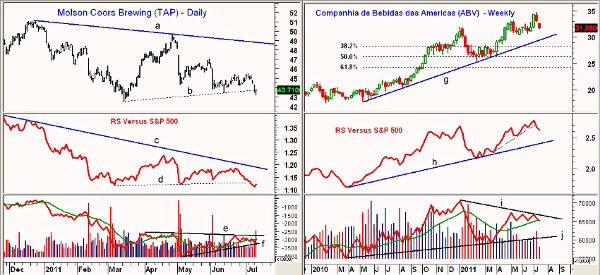
|pagebreak|Molson Coors Brewing Company (TAP) traded lower early Tuesday, but then closed higher on the day. The key support is at $42.50 and the March lows. Monday’s close was below the trend line support at line a.
- Next major support is from the May 2010 lows at $38.89
- The daily downtrend in the RS, line c, goes back to late 2010. The RS just broke support at line d, which does favor further weakness
- Volume was heavy on Tuesday with the higher close, but the OBV is still below resistance at line e. A break of support at line f would be negative
- Weekly OBV (not shown) could drop below its weighted moving average this week
- There is initial resistance for TAP at $44.24, and a close above $45.50 is needed to improve the short-term outlook
Companhia de Bebidas das Americas (ABV) has clearly been the strongest brewer since the May 2010 lows, as it has risen from a low of $17.82 to last week’s high at $34.68. ABV has declined below the lows of the past two weeks with initial trend line support at $31.10.
- The major weekly trend line support (line g) is in the $29.50 area with the 38.2% support at $28.20
- Weekly RS is in a well-established uptrend, line h, with a pattern of higher highs. The short-term support (dashed line) has been broken. This is consistent with a correction, similar to what occurred in early 2011
- The weekly OBV did not confirm the recent highs, line I, and has formed a six-month divergence. The WMA could be broken this week. Daily OBV (not shown) is negative
- Initial resistance is at $32.85-$33.24 with stronger resistance at $34-$34.68
What It Means: When looking at an individual stock, it is always important to look at its industry group or sector as well. As the chart of ABV illustrates, there are often some excellent performers, even in a weak industry.
Of course, the percentages are better when you buy a stock that is technically strong (by volume and RS) that is also in a sector or industry group that is acting stronger than the market.
Certainly, the technical outlook does not favor buying any of these brewers, even if they have seemingly attractive yields.
How to Profit: Those long any of these brewers should have hard stops in place. ABV also looks vulnerable, and a drop below the last weekly swing low at $30.43 could mean a test of the 38.2% support at $28.20.


