
Recent strength in homebuilding stocks may set up good trading opportunities, but as long as the overall trend remains down, long-term investors should stay away.
The latest Case-Schiller Housing Price Index caught many by surprise when it reported an unexpected rise of 1.1% for June. The year-over-year results showed that the index has declined by 4.6%.
The surprise increase boosted the homebuilding stocks, as many were already trading well above their recent lows.
The Dow Jones Home Construction Index completed a major head-and-shoulders top in May 2006. It peaked in 2005 at 1100 and closed Tuesday at 208. It is down 81% from the 2005 highs.
Though the SPDR S&P Homebuilders ETF (XHB) and the key homebuilding stocks have provided some good trading opportunities in the past, there are no signs yet of a major bottom.
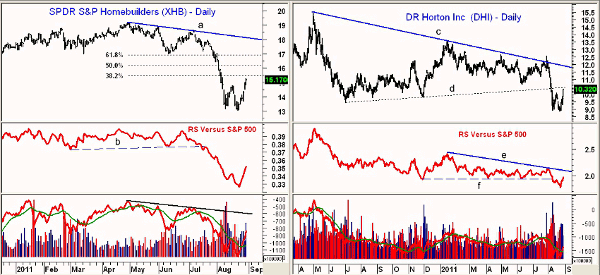
Click to Enlarge
Chart Analysis: The SPDR S&P Homebuilders ETF (XHB) has bounced nicely from its recent low at $13.05 and is already close to the 38.2% retracement resistance at $15.44.
- The 50% retracement resistance from the April 29 high is at $16.10
- There is significant chart resistance in the $17 area with the downtrend, line a, at $18
- The relative performance, or RS analysis, broke support (line b) in July when XHB was in the $17.50 area. It has turned up but is still in a longer-term downtrend
- The on-balance volume (OBV) moved above its weighted moving average (WMA) last week, while the weekly OBV (not shown) is still well below its declining weighted moving average
- There is initial support for XHB in the $14.50-$14 range
D.R. Horton (DHI) is a $3.3 billion company that currently yields 1.5% and has a book value of $8.20. Its recent low was $8.82 and the stock gained 2.1% on Tuesday.
- DHI has risen 17% from its lows and has just reached first chart resistance in the $10.50 area, line d
- The 38.2% retracement resistance from the April 2010 high ($14.42) is at $11.40 with the downtrend, line c, at $11.80
- The RS line broke to new lows in August and is below its short-term downtrend, line e
- Volume has picked up on the rally, but is still below the levels seen on the early-August decline. The daily OBV is above its weighted moving average but shows no signs of an important low
NEXT: PulteGroup (PHM) Stages Sharp Recent Rally
|pagebreak|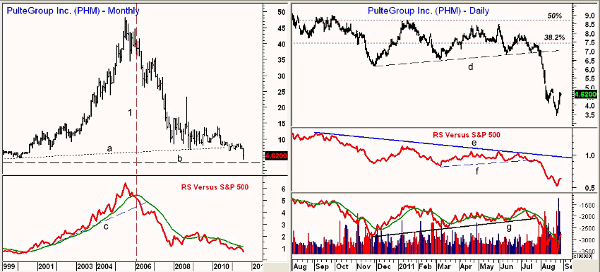
Click to Enlarge
PulteGroup (PHM) was one of the star performers on Tuesday, as it was up 6.1% and is now up over 35% from the August 23 lows at $3.40. This rally should first be viewed from the long-term charts.
- The long-term monthly chart goes back to 1999 and clearly shows the break to new lows in August with next major support, line b, in the $2.50 area
- The support at $7.25, line a, was first broken in November 2010
- The RS analysis moved above its weighted moving average in July 2000 and stayed above it throughout the bull market
- The RS line finally dropped below its weighted moving average at the end of February 2006 when PHM closed at $38.40. The uptrend, line c, was broken a few months later
- The monthly RS analysis is still negative as it is below its declining WMA
The daily chart for PHM shows the recent sharp rally with next resistance in the $5-$5.20 area. The minor 50% Fibonacci retracement resistance, as calculated from the early-2011 highs, is at $6.05.
- There is strong chart resistance in the $6.50-$6.80 area, while the major 38.2% resistance, as calculated from the April 2010 high, is at $7.45
- The daily RS has turned up, but so far has not been that impressive. It broke support, line f, in July before the 50% decline. Longer-term RS resistance stands at line e
- Volume has been heavy over the past few days and there have been several days with over three times the average volume
What It Means: The recent strength in the homebuilders has been impressive. Some of the beaten-down stocks like PulteGroup (PHM) could gain another 20%-30% from current levels, but there are no signs yet of a major low.
For traders, a setback towards the recent lows may set up a trading opportunity, but long-term investors should stay away until the weekly RS analysis suggests that the homebuilders are starting to outperform the S&P 500.
How to Profit: Since it has been over six years since the homebuilders topped out, one has to think that we are within a year or so of a major low.
For traders, a 50% pullback over the next week or so could set up a good trading opportunity, but be sure the risk is well controlled because the dominant trend for the homebuilders is still down.


