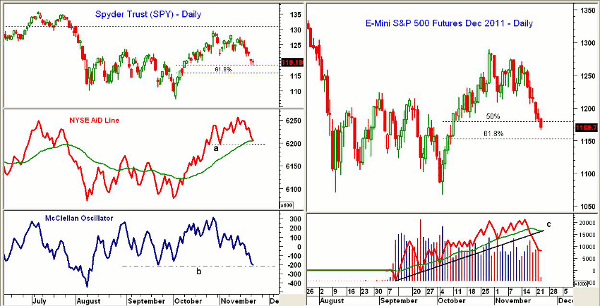
While the pullback to key support seen in major averages is a caution sign for now, it’s also likely to result in a rally next week—one that will be critical for the market’s intermediate-term future.
The heavy selling Monday and additional losses on Tuesday have taken the major averages to the next key areas of support. Additional selling in the S&P futures early Wednesday has taken them below the 50% Fibonacci support levels.
For those not familiar with Fibonacci analysis, if prices break below the 50% support, it implies that prices will then drop to the 61.8% support. A daily close below that level will give confirmation that the trend has changed from up to down. Of course, in declining markets, we watch to see if the 38.2% retracement resistance is overcome, and if it is, we then look at the 50% and 61.8% retracement resistance levels.
Some of the daily studies have turned negative, while others like the market internals are negative on some market sectors but still positive on others. Sentiment has started to shift once more, as some are again expecting the economy to slip back into a recession.
Today, we get the latest numbers on jobless claims and durable goods. If jobless claims continue to decline, it might take some pressure off the market, and a better-than-expected durable goods report would have the same effect.
The short-term Advance/Decline (A/D) indicators are now as oversold as they were in late September and early October, which makes a rally likely by next week. That rally would need to be very impressive to signal that the correction from the late-October highs is over.
Chart Analysis: The Spyder Trust (SPY) tested the 50% retracement support in the $118.50 area. A daily close below this level will suggest a decline to the 61.8% support at $115.83.
- There is initial resistance for SPY at $120.30 and then in the $121.45 area. A close above $124.16 is needed to turn the chart positive
- The NYSE A/D line has dropped down to test it’s still-rising weighted moving average (WMA) with important support at the November lows, line a. A downtrend has not yet been confirmed
- The McClellan Oscillator closed Tuesday at -202, just above the September low of -206. It hit a low of -446 in August
- On an oversold rally, the McClellan Oscillator could rebound back to the +50 to +100 level
The December E-mini S&P 500 futures contract violated the 50% retracement support early Wednesday when it traded as low as 1166.75.
- A close below the 50% support will suggest a decline to the 61.8% support at 1152.75
- There is further chart support in the 1130-1135 area
- The on-balance volume (OBV) dropped below its weighted moving average last Friday and the heavy volume on Monday has pushed it further below that level
- The weekly OBV (not shown) is still above its weighted moving average but needs a strong close in the next two weeks to stay positive
- There is first resistance now at 1185-1192 with stronger resistance at 1202-1205. A close back above this level would be positive
NEXT: The Strongest of All Stock Index ETFs
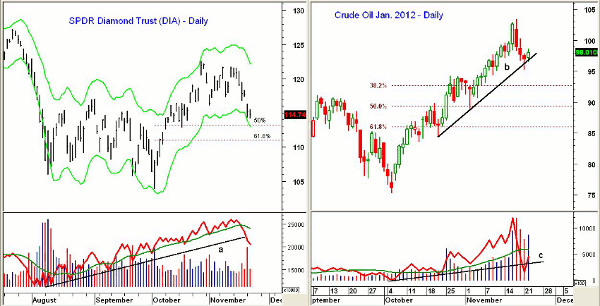
|pagebreak|The SPDR Diamonds Trust (DIA), which tracks the Dow Industrials, has held up the best of the major index ETFs and is still well above the 50% retracement support at $113.21. This also corresponds to the daily Starc- band.
- There is chart support at $112.50 with the 61.8% Fibonacci retracement support at $111
- The daily OBV has broken its uptrend from the September lows, line a, which is negative. The volume was the heaviest since September 22nd.
- A failing rally back to its now declining WMA would be negative.
- There is first chart resistance in $116.50 with further at $119.50
The January crude oil contract peaked last Friday, hitting a high of $103.73, but then closed at $98.93. Crude traded as low as $95.24 on Monday but closed higher on Tuesday.
- The steep daily uptrend, line b, was broken during Monday’s session, but crude closed back above it
- So far, crude has held well above the 38.2% support at $92.80
- The daily OBV confirmed the recent highs before dropping below both its weighted moving average and the uptrend, line c
- The weekly OBV (not shown) is still clearly positive and shows no signs yet of an intermediate-term top
What It Means: If the selling continues into the close on Wednesday, it will further weaken the short-term outlook, but will also increase the probabilities of a sharp rebound by the middle of next week. This rally will need to be watched closely, and if it is not accompanied by strong (four-to-one or better) A/D ratios, it is likely to be a selling opportunity.
On the positive side, the action of crude oil on Tuesday suggests it may be ready to turn higher. A stronger close Wednesday will set the stage for a rebound in the stock market, as crude oil often leads the equity markets.
How to Profit: Many of the strong stocks in the best sectors have held above the November 1 lows, so stops under these levels should have held. These stops should be raised on the next rally and shareholders should look to take partial profits on the rebound. This cash will then be available to purchase small-cap stocks in preparation for the “January Effect” seasonal pattern.


