One of my favorite short-term momentum tools is called the RSI3, which is a short-term modification of the Relative Strength Index (RSI) developed by Welles Wilder. I first learned about this modification of the RSI from an old friend and leading cycle analyst, Walter Bressert. It is calculated by calculating a five-period RSI, then taking a three-period simple moving average (SMA) of this value.
By looking at whether the RSI3 is rising or falling, traders and investors can get a good reading on whether a market’s long-term momentum is positive or negative.
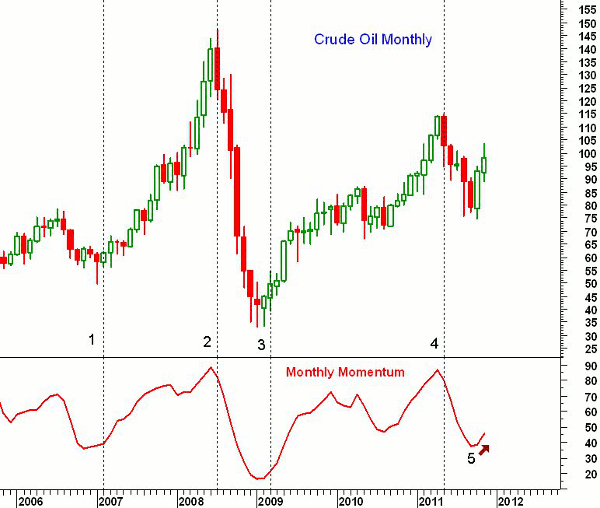
Chart Analysis: The monthly momentum analysis is not as clean on all markets as it has been for crude oil over the past five years.
- At the end of January 2007 (line 1), the momentum had been rising for several months. This was a positive sign for crude oil, which closed that January at $61.79
- The momentum stayed positive until the end of June 2008, line 2, when a downtrend was confirmed. Crude oil closed the month at $124.08 and had more than doubled from the January 2007 close
- Crude oil prices plunged until early 2009, hitting a low of $41.68 in early 2009. The momentum turned up by the end of February and crude oil closed at $49.66
- Momentum rose until late 2009 before forming a short-term negative divergence (see box). Crude oil declined into August 2010
- With the October 2010 close at $81.43, the momentum had again turned higher
- This signal lasted until the end of May 2010 (line 4) when crude oil closed at $102.70
- At the end of this month, the momentum will have closed higher for the second consecutive month, as crude is currently trading above $96. It closed October 2011 at $93.19
NEXT: More Momentum Trends to Watch in December|pagebreak|
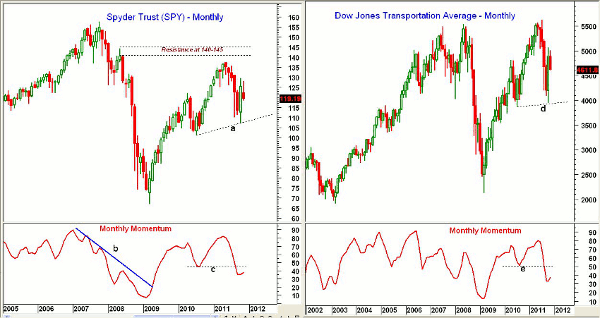
The monthly chart of the Spyder Trust (SPY) shows that the momentum closed higher in October, and SPY is currently trading below the October close of $125.50.
- There is key monthly support for SPY at $107.43-$108.65, line a
- Momentum did a good job of catching the 2009 lows, as it broke its downtrend, line b
- The momentum broke support, line c, last summer, so if it turns down once more, it would be quite negative
- If November’s lower close is followed by a lower close in December, the momentum is likely to resume its downtrend
The Dow Jones Transportation Average has been a market leader since the 2009 lows, but the index gave up that leadership in May when the weekly on-balance volume (OBV) formed a negative divergence.
- Momentum on the Transports is trying to turn up as we end November, even though we are likely to close the month lower
- The break of momentum support, line e, is a potential negative from an intermediate-term perspective unless it can move back above this resistance
- Momentum did turn up in mid-2008, which was part of a bear market rally
- For the momentum to keep rising, the Transports need to close December higher
What It Means: The monthly momentum can often give some valuable information about the dominant trends, and traders can use the same formula on daily charts as well (as discussed here previously).
For crude oil (which was lower before the close on Wednesday, Nov. 23), the major trend is likely to remain positive as we head into the New Year.
As for SPY and the Dow Jones Transportation Average, a lower close in December is likely to cause the momentum to break below the recent lows, which would weaken the longer-term trend.
How to Profit: By keeping an eye on the momentum analysis, one can adjust the asset mix in their retirement portfolio. As a result, the action in December could be especially significant.


