Three of the most technically overbought Nasdaq 100 stocks are health care leaders entering their strong seasonal periods, and monthly chart analysis can be used to find favorable price levels for new buying.
While the Nasdaq 100 is down over 5% from the early-April highs, my weekly scan revealed that ten stocks are still within 6% of their weekly Starc+ bands. Those stocks that are able to hold near their highs during a market correction are likely to be market leaders once the correction is over.
This week I have added two additional columns to the table, one for the three month low and the other for the three month high. As of last Friday’s close you will note that quite a few stocks are still quite close to their three month highs as these stocks have recently been on the list of stocks making new highs.
I was also interested that there were three health care stocks on the list. The health care sector is now entering a strong seasonal period and should be a favorable spot for new buying once the market correction is over. The three-month lows for each of these stocks can provide another way to identify favorable risk/reward buying zones, as stops can often be safely placed just under these lows.
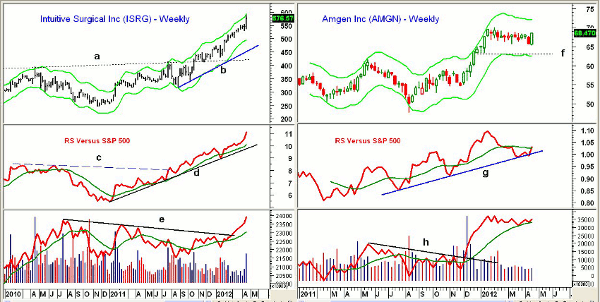
Chart Analysis: Intuitive Surgical Inc. (ISRG) is a $22.5 billion medical appliance and equipment supply company that is an innovator in the new field of surgery robotics. The stock is up over 58% in the last year and well over 300% in the past five years.
- The weekly chart shows a major breakout through the resistance in the $420 area, line a, last October
- The relative performance, or RS analysis, broke through resistance (line c) in July, leading prices by several months
- The RS line is in a strong uptrend, line d, indicating that ISRG likely to stay a market leader
- On-balance volume (OBV) lagged the price action as it just overcame two-year resistance, line e, in early March
- There is initial support now in the $530-$550 area and then at $500. The three-month low is much lower at $451.35
Amgen Inc. (AMGN) is a well-known, $55.4 billion biotechnology company. Even though it is just 5.4% below its weekly Starc+ band, AMGN has been in a tight, $4.20 range for the past 14 weeks. The company will report earnings after the close on Tuesday (April 24).
- The three-month low is at $65.37, just 4.5% below last week’s close
- Even stronger support stands in the $63 area, line a, which also corresponds to the weekly Starc- band
- The RS line has turned up from its uptrend, line g, and closed last week just above its weighted moving average (WMA)
- OBV surged in December and broke through its downtrend, line h. It is still holding above its weighted moving average
- A daily close above the $69 level will trigger a breakout on the daily charts
- In 2006-2007, AMGN had a high of $77 and traded as high as $87 in 2005
NEXT: Another Health Care Stock Prone to a Correction
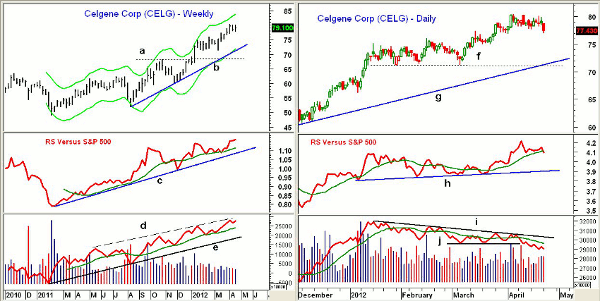
|pagebreak|Celgene Corp. (CELG) is a $34 billion biotechnology company whose stock broke out to the upside in mid-January when it closed well above resistance at line a. It is currently 6% below its weekly Starc+ band at $83.80. The company will report earnings the morning of Thursday, April 26.
- CELG traded as high as $80.42 this month, exceeding the 2008 high of $77.29
- The RS analysis has been strong since early 2011 and shows a solid uptrend, line c
- OBV has been confirming the price action, as it has formed a series of higher highs, line d
- OBV is holding well above its weighted moving average and has long-term support at line e
- There is first weekly support in the $76 area
The daily chart of Celgene Corp. (CELG) shows the weak close on Monday, during which the stock came very close to making new lows for the month.
- There is more important in the $72-$74 area and a three-month low of $71.23, line f
- Daily RS analysis has dropped below its weighted moving average and could drop back to more important support at line h
- Daily OBV is negative, as it formed lower highs (line i) and broke support (line j) almost two weeks ago
- The daily chart has resistance in the $78-$80 area
What It Means: Each of these three health care stocks show positive weekly relative performance, suggesting they could be market leaders for the rest of the year. Intuitive Surgical Inc. (ISRG) could move above the $600 level in 2012, but it would take quite a correction to present a good buying opportunity.
Both Amgen Inc. (AMGN) and Celgene Corp. (CELG) are more likely buy candidates in the next month or so.
How to Profit: Amgen Inc. (AMGN) could break out of its daily range following its late-Tuesday earnings report, but given the overall weak market, the risk of buying ahead of the report is too high.
The weakness in the daily technical studies for Celgene Corp. (CELG) does increase the chances of a deeper correction that would take the stock back to a favorable buying level.


