The sweltering summer has caused intense damage to a number of US cash crops, and investors have responded by pushing related ETFs to new highs. But at these levels, some of these plays look much more attractive than others.
It is only mid-July, but many of us on the East Coast are already thinking of moving further north in an effort to escape the heat. But how far north does one have to go?
Of course, one’s personal discomfort does not measure up to the devastation that many farmers and ranchers are facing throughout the country. The drought has already severely impacted the corn crop, and is now putting the soybean crop in danger. The September corn contract has soared from $5.09 per bushel in mid-June to over $7.40 now.
Many experts are predicting that this summer’s heat will have a long-term impact on many of the commodity markets, and therefore on food prices. This has helped push the popular commodity ETFs sharply higher—but does this mean that a long-term low is in place?
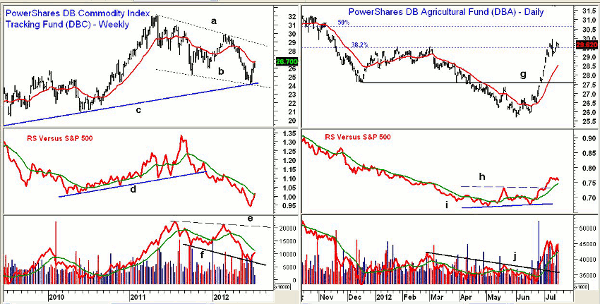
Chart Analysis: The PowerShares DB Commodity Index Tracking Fund (DBC) covers a wide range of commodities, but has its highest concentration in the energy markets. It also invests in gold, as well as corn, sugar, and soybeans. It has a relatively high expense ratio of 0.87%.
- DBC peaked in 2011at $32.02, and with the plunge in crude oil prices hit a low of $24.11 in June.
- DBC is up over 12% from the lows, but is still well within the weekly flag formation (lines a and b).
- The uptrend going back to April 2009 (line c) was tested in June.
- The relative performance, or RS analysis turned negative in December 2011, as support (line d) was broken.
- The RS line could move above its WMA this week, but is still is in a downtrend.
- The on-balance volume (OBV) dropped below its WMA in late March, catching the slide in crude oil prices.
- The weekly OBV is still below its WMA, while the daily OBV (not shown) is positive.
- There is next resistance at $27.80 to $28, with the downtrend (line a) in the $29 area.
The PowerShares DB Agricultural Fund (DBA) concentrates on the agricultural sector, and has over 10% in sugar, live cattle, corn, soybeans, and cocoa. It has an expense ratio of 0.92%, and is up 15% from the May low of $25.72.
- The daily chart shows that the 38.2% Fibonacci retracement resistance from the 2011 high at $35.58 has been overcome.
- The 50% retracement resistance is at $30.65, with the long-term downtrend at $31.70.
- The daily RS analysis has completed a short-term bottom, having moved above resistance (line h). It is above its WMA.
- The daily OBV broke its downtrend (line j) in late June, and volume has been high over the past few weeks.
- The weekly OBV (not shown) has broken its long-term downtrend, and is acting stronger than prices.
- There is minor support now at $29, with the rising 20-day EMA at $28.50.
- More important chart support now sits in the $27.50 area (line g).
NEXT: Is Another ETF Ready to MOOve Up?
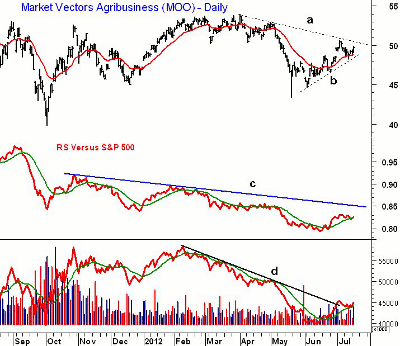
|pagebreak|The Market Vectors Agribusiness ETF (MOO) invests in companies that derive at least 50% of their revenues from the business of agriculture. Monsanto (MON), Potash of Saskatchewan (POT), Deere (DE), and Syngenta AG (SYENF) are the top four holdings, with a weighting of over 7% each. It has an annual expense ratio of 0.53%.
- MOO peaked in early April at $53.89, then dropped as low as $43.43 in May.
- The downtrend (line a) was tested in June, and is now at $50.50.
- The daily relative performance is in a short-term uptrend, but is still well below long-term resistance (line c).
- The weekly RS analysis (not shown) has improved, as it is above its WMA.
- The daily OBV broke through its downtrend (line d) in late June. The weekly OBV is more positive, well above its WMA.
- The daily chart now shows a short-term uptrend (line b), with initial support at $48 and stronger levels at $46 to $46.60.
What it Means: The PowerShares DB Agricultural Fund (DBA) has likely completed a significant bottom, as the weekly OBV action is quite positive.
DBA closed last week above its weekly Starc+ band, and is trading above it again this week. Therefore, the risk in buying now looks to be quite high, and investors should look for a pullback or some consolidation in the next several weeks before buying.
The PowerShares DB Commodity Index Tracking Fund (DBC) does not look as strong. While the short-term outlook for crude oil is positive, the recent drop did quite a bit of technical damage. The next one- to two-week pullback in DBC will tell us more.
The daily action in the Market Vectors Agribusiness ETF (MOO) suggests a bottom may be in place, but the chart formation is not that strong. A break below $48.25 could change the direction quickly. I like many of the stocks that make up this ETF, but its closeness to next strong resistance makes me cautious at this time.
How to Profit: I will be keeping an eye on the PowerShares DB Agricultural Fund (DBA), especially if it gets back to the $27.50 to $28 area.


