The stock market was punished again for the third day in a row, but MoneyShow’s Tom Aspray takes a closer look at two large-cap stocks that bucked the trend, in search of optimal entry points.
If the rest of the summer is like Monday, you won’t need to visit an amusement park if you want a roller coaster ride. A couple of hours into the New York session, the Dow had lost close to 250 points and short-term rates were up sharply.
Just before 3:00 pm Eastern time, the Dow was only down 50 but then the sellers again took over as it dropped 50 points in the last five minutes. In addition to still lingering concerns over the Fed’s plans, the spike in China’s overnight rates and the plunge in the Shanghai Composite was another reason to sell.
Again, the market internals were very weak with declining issues leading the advancing stocks by over a 4-1 margin. The market continues to get more oversold as the number of NYSE stocks above their 50-day MAs has dropped below 26. Overnight comments from China tried to calm the markets and we get more economic data today including Durable Goods and the S&P Case-Shiller Housing Price Index.
The stock futures are showing slight gains in early trading, but there are still no signs of a bottom. A very sharp rally is very likely in the next few days. There were a few bright spots as typically not all stocks bottom out at the same time, and seasonally, stocks generally do better in July than they do in June.
These two Dow stocks bucked the trend as they were up 1.7% and 1.3% Monday. Where and when should you be looking to buy?
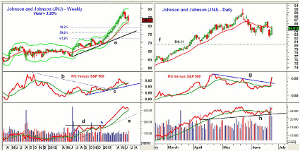
Chart Analysis: The weekly chart of Johnson and Johnson (JNJ) shows the May high at $89.99 and the low last week at $82.12. This was a correction of 8.7% from the highs.
- The low last week was close to the 20-week EMA at $81.58.
- The 38.2% Fibonacci retracement support from the early 2012 lows is at $79.11.
- The weekly uptrend (line a) and the 50% support are in the $75.20 to $75.76 area.
- JNJ has been a favorite since early 2013 when the relative performance broke its downtrend, line b. This signaled it was a market-leading stock.
- The RS line is back above its WMA and has held well above its uptrend, line c.
- The OBV also broke out in early 2013 as resistance, line d, was overcome.
- The OBV is still well above its WMA and the longer-term uptrend.
- Using current data the third quarter pivot is at $84.50, which represents first resistance.
The daily chart of Johnson and Johnson (JNJ) shows Monday’s strong close as the decline tested the early April high at $82.95.
- There is next resistance is at $85.76 and then at $86.50, which if overcome on a closing basis would be positive.
- The relative performance has moved sharply above its downtrend, line f, and appears to have completed its correction.
- The volume has been heavy over the past two days as the OBV has surged above its WMA and is already close to the May highs.
- The low three weeks ago was $83.31.
- The April low was $80.31, line a, which is well above the recent correction lows.
NEXT PAGE: Another Bottoming Dow Stock
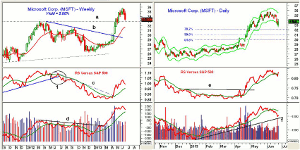
|pagebreak|Microsoft Corp. (MSFT) had a high four weeks ago at $35.78 with an early low Monday at $32.57 before some buyers stepped in.
- This low corresponded to the April 2012 high, line a.
- The break of the downtrend, line b, in April 2013 signaled a move back to the 2012 high.
- The relative performance topped out in the summer of 2012 (point 1) as it broke its uptrend and then turned lower after retesting its declining WMA.
- This indicated that MSFT was acting weaker than the S&P 500.
- The RS line broke its downtrend, line c, in April and it is holding well above its rising WMA.
- The weekly on-balance volume (OBV) completed its base formation in March as it moved above the resistance at line d.
- The OBV did confirm the recent highs and is holding well above its WMA.
The daily chart of Microsoft Corp. (MSFT) shows that the daily starc- band has been exceeded over the past two days.
- Based on current data the pivot for the next quarter would be at $32.53.
- The 38.2% Fibonacci retracement support from the late 2012 lows is at $32.14.
- The September 2012 high is at $31.61 with the 50% support at $31.01.
- The relative performance broke out of its base formation in April as it overcame resistance at line e.
- The daily OBV peaked ahead of prices on May 20.
- The OBV is well below its declining WMA and is now close to its uptrend, line f.
- There is initial resistance at $34.16 and then at $34.90.
What it Means: The short-term outlook for the stock market is negative, and it is likely to take at least a few weeks before we could get strong signs that the correction is over.
The weekly and daily studies for Johnson and Johnson (JNJ) indicate that it has bottomed out. The outlook for Microsoft Corp. (MSFT) suggests that more time will be needed before its correction is over.
How to Profit: For Johnson and Johnson (JNJ), go 50% long at $83.92 and 50% long at $82.48, with a stop at $78.66 (risk of approx. 5.4%).
For Microsoft Corp. (MSFT), go 50% long at $31.68 and 50% long at $30.54, with a stop at $29.69 (risk of approx. 4.5%).


