MoneyShow's Tom Aspray takes a technical look at the winning and losing groups from last week, which might help give us some additional insight, as well as identify potential opportunities.
As part of your weekend analysis, it is important to review how your positions are doing and whether you need to make any changes or adjust any stops. The next step is to look for new opportunities in the week ahead.
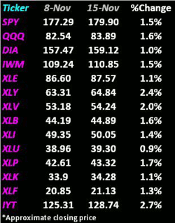
The first step for me is to review the sector ETF performance in order to quickly identify the winners and losers for the week. I use the table below from the Week Ahead column as the starting point in this process.
What I immediately notice is the 2.4% gain in the Sector Select Consumer Discretionary (XLY) and the 2.7% gain in the iShares Transportation Average (IYT). As I reviewed in last week's trading lesson, I often then go to Finviz and look at the industry groups that make up these two sectors.
I also run weekly OBV scans on the stocks in these sectors to isolate those that have positive OBV readings. These stocks are then targeted for further analysis. I also use Finviz's group function to look at the industry groups that did the best and worst.
Let's look at two of the winners from last week and two of the losers.
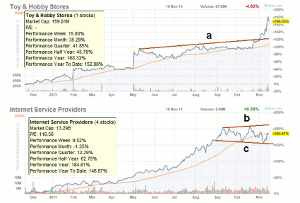
Chart Analysis: At the top of the list is Toy & Hobby Stores, which was up 15% for the week. An added feature of these charts is that if you run your mouse over the chart, you will get a breakdown of the industry group.
- In this example, you will see that it only has one
stock and the market cap is just for the stock.
- I am pointing this out as a weakness that you have to
be aware of in your research.
- The performance chart essentially reflects just Build-A-Bear Workshop Inc. (BBW).
- Its group chart shows the breakout above resistance,
line a, in early November.
- So is this a dead end in your research?
- No, the site also has a Toy & Game industry
group, which has six stocks with a capitalization of over $23 billion and it
is up over 8% this month.
- In my opinion, the two groups should be grouped together as both Hasbro Inc. (HAS) and Mattel Inc. (MAT) have strong charts.
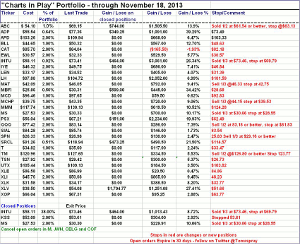
- Since Mattel Inc. (MAT) is already part of the Charts in Play portfolio, I will keep an eye on HAS for a pullback.
The Internet Service Providers also had a good week, up 9.52%, and it includes Trulia, Inc. (TRLA), which was up 11.4% last week.
- The chart of the industry group shows that it is
still in a consolidation pattern, lines b and c.
- The group is up over 184% for the year so a pause is
not surprising.
- If you look at the chart of Trulia, Inc. (TRLA), you will see that it has bounced from good
support as it had a low on November 8 of $33.43.
- It has rallied back to resistance, which makes a
pullback likely but it now belongs on my watch list.
- It is a stock that might not have otherwise shown up
on my radar.
- I was also watching for the completion of the trading
range in the groups to look at other stocks in the sector.
NEXT PAGE: Last Week's Losers
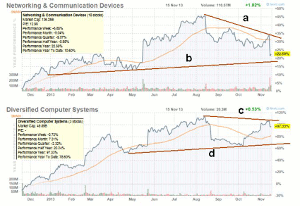
|pagebreak|It is also important to keep your eye on the worst-performing sectors, like the Networking & Communications Devices in this case, as you may find a stock that is acting well but is in a very weak group. It can also help you identify a strong group that is just undergoing a correction.
- The chart shows sharply lower highs, line a, as it is
down almost 25% from the August highs. It is still up for the year.
- The long-term support, line b, is not far below
current levels.
- Cisco Systems (CSCO) is part of this group and was an earnings
casualty last week.
- In reviewing the other stocks in this group, you will see that Digi International Inc. (DGII) broke through resistance.
- The long-term chart shows that it may be
completing a base.
- However, given the weakness of the group, I would
flag this stock for a drop back into the $10.25 area.
- The chart of the group indicates that it will take
quite a few weeks before it could bottom out.
The Diversified Computer Systems also had a rough week, down 2.72%, but is still showing a nice gain of 7.31% for the month.
- For the year, it is up over 97%.
- The chart shows resistance now at the August highs,
line c.
- The group is still well above its rising 50-day MA
and would need to drop around 17% to reach it.
- There are only three stocks in this group, but it includes two well-known names, Hewlett-Packard (HPQ) and Cray Inc. (CRAY).
- HPQ has rallied sharply from $20 to over $26 and was
overdue for a pullback.
- CRAY has been correcting from the August high with a
low on November 8 at $21.32.
- This is just above the 61.8% Fibonacci support at $20.96, which is calculated from
last May's low
What It Means: In the recent trading lesson, My Four Favorite Research Sites, I did not go into some of the details of the group analysis. Over the weekend, I realized that it should have been included as it can provide you with some very useful information.
In terms of stocks, I will be looking for a retest of the recent lows in Trulia, Inc. (TRLA). Also, the long-term patterns for Hewlett-Packard (HPQ) and Cray Inc. (CRAY) are positive and CRAY is already back to good support.
Hasbro Inc. (HAS) has a seasonal tendency to bottom out in early January and peak in September.
How to Profit: No new recommendation
Editor’s Note: Leaving early Tuesday for Las Vegas but Monday’s reversal is a potential problem as many stocks and ETFs closed on the lows after being sharply higher earlier in the day. A sharp down day Tuesday or Wednesday could generate daily sell signals. Stay tuned as I will try to update you from the road. Also be sure to follow me on Twitter.
NEXT PAGE: The Charts in Play Portfolio
|pagebreak|


