Five stocks that meet the criteria of Warren Buffett were addressed in an article published last week, and MoneyShow's Tom Aspray uses chart analysis to decide whether it is, or is not, the right time to buy them.
Even though stocks did stabilize last Friday, there was significant technical damage, as only the PowerShares QQQ Trust (QQQ) has not given strong weekly sell signals. Only the iShares Russell 2000 (IWM) looks ready to rebound over the near term, but it shows no signs yet, that it has completed its correction.
The market consensus seems to be growing that the FOMC will decide to start the tapering process at this week's meaning. In last Friday's column "Is This the Next Taper Stopper?", I discussed one reason they may not decide on tapering at this week's meeting.
How are stocks likely to react if they do, or do not, start tapering? That is a tough call, as conventional wisdom suggests that a tapering decision would pressure the market, while no taper will stimulate further buying. The market, this time, is likely to surprise the majority. The put/call ratios have turned up, but still have a relatively low level of bearish sentiment.
Last week, an article by Mark Hulbert discussed the results of a recently published study on the efforts to duplicate the investment "formula" behind Warren Buffett's astounding investment success. Is it really possible to put the Buffett formula in a bottle?
One of the more surprising findings, from the highly accredited professionals that authored the report, is the role margin has played in his success. The authors all work for ARC Capital Management, which manages $90 billion.
In Mark's article, there are five stocks in the S&P 1500 which, according to FactSet, meet the criteria of "cheap, safe, quality stocks," and also, pay out a significant amount of their earnings to dividends.
But do the charts of any of these stocks currently favor new buying?
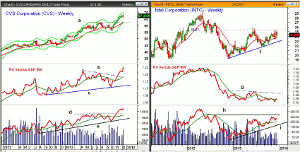
Chart Analysis: CVS Corporation (CVS) is an $81 billion dollar drug retailer that has a current yield of 1.34%.
- The weekly chart shows that CVS closed above the key resistance at $62.60, line
a, in early November.
- There is next support at $65.50, and a close below this level will suggest a drop to the monthly projected pivot support at $63.38.
- The rising 20-week EMA is at $61.93.
- The relative performance is acting very strong, as it
broke through its resistance one week after prices.
- The weekly on-balance volume (OBV) broke about ahead of prices,
as it overcame the resistance at line d.
- The weekly OBV shows strong support at line e, and
the daily OBV did confirm the recent highs.
- Last week's high was $68.73 with the weekly starc+
band at $70.34.
Intel Corp. (INTC) is another stock that was mentioned, and it has a current yield of 3.60%. The stock has gotten some positive press lately, suggesting it may now be poised to participate in the mobile revolution.
- The weekly chart shows the sharp break from the early
2012 high at $29.27.
- The 61.8% Fibonacci retracement resistance at $25.46
was exceeded in 2013, but not on a closing basis.
- There is even stronger resistance in the $26.50-$27
area.
- The relative performance has been range bound for most of
2013 and is just barely above its WMA.
- The RS line needs to move strongly above the
resistance, at line g, to indicate that INTC is again a market leader.
- The weekly OBV is acting stronger, as it has formed
higher highs and higher lows with next major resistance at line h.
- The OBV has good support well below current levels,
at line i.
NEXT PAGE: Two More Stocks to Consider
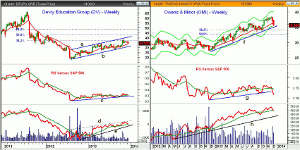
|pagebreak|The Devry Education Group (DV) is a $2.15 billion dollar educational services company that has a current yield of 1.0%.
- The close last week was below the prior six week
lows, and just above the 20-week EMA, at $33.32.
- The lower boundary of the trading channel is at
$30.96 and the quarterly pivot is at $30.57.
- In August 2013, the low was $28.00.
- The relative performance is still holding above
support at line c, and is just barely below its WMA.
- The weekly OBV is now testing its WMA, with more
important support at line e.
- The daily studies (not shown) are negative.
- The November rally just barely exceeded the 38.2% Fibonacci retracement resistance at $38.45, with the
50% resistance at $44.97.
Owens & Minor (OMI) is a $2.24 billion wholesaler of medical equipment, with a dividend yield of 2.50%. A weekly low close doji was triggered a week ago.
- OMI is now down 7.8% from the recent high, as it
closed below the 20-week EMA.
- The weekly uptrend, line f, is at $35.06, with the starc- band at $34.76.
- The 38.2% Fibonacci retracement support from the 2012
low is at $33.61.
- The relative performance broke support, line g, on
December 6, indicating it is weaker than the S&P 500.
- The weekly OBV did confirm the recent highs but is
now testing its rising WMA.
- There is more important OBV support at the uptrend,
line h.
- The daily technical studies (not shown) have been
negative since early December.
- There is a band of resistance now in the
$36.60-$37.40 area.
What it Means: This is definitely an interesting article and study, though I am a bit skeptical that it is really possible to duplicate the Buffett investing model.
Spartan Stores (SPTN) was also mentioned, and while it does look the most positive after CVS Corporation (CVS), it is well above support and overdue for a pullback.
The iShares MSCI USA Quality Factor (QUAL) was an ETF mentioned in the article, but it is relatively new and quite thin, with an average volume of just 32K.
Given the negative outlook for the overall market, I would only look to buy at important support.
How to Profit: For CVS Corporation (CVS), go 50% long at $62.16 and 50% long at $61.36, with a stop at $58.77 (risk of approx. 4.8%).


