
With the year-end "portfolio dressing" in progress, MoneyShow's Tom Aspray scans for stocks with the best long-term potential, as well as those that are most vulnerable, in the sector most favored by money managers.
As stocks continue to accelerate to the upside, those under-invested money managers are wondering how they can "dress up" their portfolios by the end of the year. The DJIA led the charge, Thursday, gaining 0.75% for the 50th new closing high of the year.
The Dow's gain was significantly better than the 0.47% higher close in the S&P 500. The market internals were positive but not stronger than prices, with 1650 issues advancing and 1439 declining. The Advance/Decline lines have confirmed the price action but the NYSE McClellan oscillator did turn lower on Thursday.
Many of the stocks that money managers would like to have in their portfolios are in the Nasdaq 100. The PowerShares QQQ Trust (QQQ) is up 4.4% in the past six days as it closed Thursday at $87.74, which is 0.7% above its monthly starc+ band at $87.07.The QQQ has not been this close to the monthly starc+ band resistance since March 2012. This preceded a 12.4% correction.
Click to Enlarge
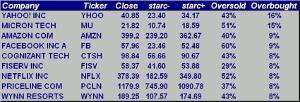
The monthly starc+ band scan of the Nasdaq 100 stocks as we approach the end of the month reveals that there are nine stocks that are 8% or more above their monthly starc+ bands. Many of these stocks have been close to these bands for several months. The top stock on the list is Yahoo! Inc. (YHOO), which is up 104% for the year and 22.5%, so far, this quarter. It is currently an astounding 18% above its monthly starc+ band.
These market-leading stocks can still go higher even though they are high risk, basis the monthly starc band analysis. As was the case for SPDR Gold Trust (GLD) and Apple Inc. (AAPL), trading near or above the monthly starc+ bands for several consecutive months does often warn of sharp, and sometimes long-lasting, corrections. One needs to keep an eye on the weekly and daily analysis in conjunction with the monthly technical studies to obtain advance warnings of significant tops.
Of course, the risk analysis quickly also tells one which stocks or ETFs are too far above monthly support which requires very wide stops on new positions. For example, if you bought YHOO, Thursday, at $40.65, a stop under the month's low at $36.25 would be a risk of more than 12%.
These four most overbought Nasdaq 100 stocks are the ones I found the most interesting from the most overbought list.
Click to Enlarge
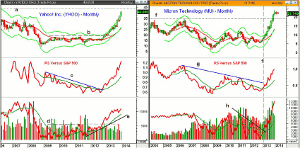
Chart Analysis: The monthly chart of Yahoo!, Inc. (YHOO) shows that 40-month resistance, line b, was overcome on a closing basis at the end of 2012.
- YHOO
is now approaching the 2005 high of $43.66 (line a) but well below the
all-time high from early 2000 of $125.03.
- The monthly relative performance broke its 3-? year downtrend in late 2012
before prices broke out.
- The RS line is rising very sharply and shows no signs yet of a top.
- The monthly on-balance
volume (OBV) bottomed in 2011 and was in a clear uptrend in early 2012
even though prices were flat.
- The major resistance, line d, was overcome at the end of October 2012.
- The OBV is likely to make a marginal new high this month though its upward
progress has slowed.
- The weekly OBV (not shown) has made a convincing new high this week.
- The daily technical indicators show some loss of upside momentum.
- There is initial support now at $38.82 with the 1st quarter pivot support
is at $37.80.
Micron Technology (MU) was one of the more surprising tech winners of 2013 as it is up 240% YTD and over 24% in just the past three months.
- It is 15% above its monthly starc+ band even though it is down over 8%
from the December 9 high at $23.66.
- This is evident on the candle chart (see arrow).
- MU
is still well below the major 38.2% Fibonacci
retracement resistance at $38.17, which is calculated from the 2000 high at
$97.50.
- The 2006 high at $18.65 (line f) was overcome in October as prices
accelerated to the upside.
- The long-term downtrend in the relative
performance, line g, was broken in April 2013.
- The RS line has moved well above the 2009-2011 highs.
- The monthly OBV broke its downtrend, line h, ahead of prices and has
accelerated to the upside in the past few months.
- The weekly studies (not shown) are declining but did confirm the recent
highs.
- The 1st quarter pivot will be at $20.53 with stronger support at
$18.50-$19.
NEXT PAGE: 2 Tech Stocks to Watch
|pagebreak|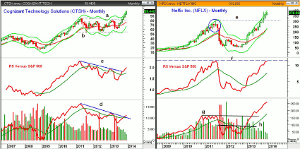
Click to Enlarge
Cognizant Technology Solutions (CTSH) is up just 34.6% YTD as it just completed the monthly flag formation, lines a and b, at the end of September. This makes the $82.50-$84 area major support.
- The upside target from this formation is in the $110-$112 area.
- CTSH
is currently trading 8% above its monthly starc+ band.
- The downtrend in the relative performance, line c, was broken this
fall.
- The RS line is still below the prior two highs and has not confirmed the
price action.
- The OBV just moved above its downtrend, line d, in November but has not
been impressive on the rally.
- The OBV is still below both the 2013 and 2011 highs.
- The weekly and daily studies (not shown) are positive but the weekly
indicators have also not confirmed the highs.
- There is first good support in the $92.20-$93.44 area, which is the 1st
quarter pivot.
Netflix, Inc. (NFLX) is up a whopping 307% YTD as it has moved well above the 2011 high at $304.79.
- In October, NFLX
had an extremely wide range from $282.80 to $389.16 as the prior month's high
and low were both violated.
- The October range likely scared or stopped many out of their positions.
- NFLX
has been near or above the monthly starc+ band for the past four months.
- The circle highlights the 2011 top as a low
close doji sell signal was triggered one month after the top.
- The relative performance has just reached the 2011 highs, line f, and is
well above its sharply rising WMA.
- The monthly OBV completed its bottom at the start of 2013 as resistance at
line h was overcome.
- The breakout to new highs was confirmed when the OBV moved above the prior
highs, line g, in April.
- There is first good support in the $350-$352 area, which includes the
December low.
What It Means: Of these four stocks, the one that I will be watching the closest after a correction is Cognizant Technology Solutions (CTSH). The completion of a 30-month flag formation generally will have multi-year significance. The lagging action of the monthly technical studies will require close technical monitoring once a correction is underway.
Netflix, Inc. (NFLX) looks the most vulnerable to me due in part to its past history and the fact that it is in the ultra-competitive video market. In 2011, NFLX peaked in mid -July and the weekly technical studies had moved strongly in the sell mode three-four weeks later. What followed was a very violent five-month 80% decline.
How to Profit: No new recommendation


