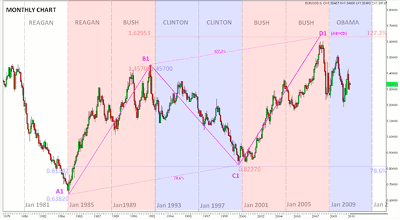
First off, is EUR/USD headed towards parity? Based on correlation to past US presidential administrations, yes. With the exception of Ronald Reagan’s first term, the EUR/USD has generally found strength during the conservative administrations of George H. and George W. Bush, and weakness during the liberal Clinton administration.
From a Fibonacci-based geometric pattern standpoint, there are several distinct pricing correlations between the current Obama administration and that of the previous Clinton administration that suggests further EUR/USD weakness in the months, and perhaps even years, to come.
The first of these price pattern correlations comes with the bearish AB=CD pattern beginning at Reagan’s second term of office in January 1985 (point A1). A nearly equal rally occurred during the conservative administrations (A1-to-B1, and C1-to-D1), both in terms of price and time, giving us a true AB=CD pattern completion, and thus a higher probability for a change in direction, which we are currently seeing.
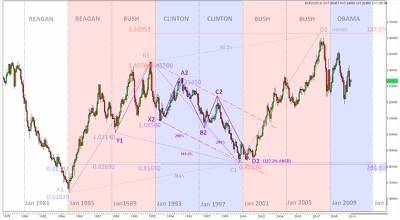
The Clinton administration saw the euro retreat down to 78.6% support of the previous eight-year uptrend (A1-to-B1), bottoming out at .8227 (point C1). This, along with several additional levels of converging Fibonacci/pattern support, provided the floor for the subsequent eight-year rally. In addition to the 78.6% A1-B1 support, the bottom at C1 (.8227) was supported by the following:
1) 141.4% extension of the Y1-B1 rally (during 1989-1993 Bush admin.)
2) 200% of both the X2-A2 and B2-C2 rallies
3) 127.2% ABCD(2) pattern extension (C2-D2 is 127.2% longer than A2-D2)
So why is all this important? Aside from the generalized political party correlation, current price action actually mimics what was seen during this previous period of euro weakness, only at twice the pace. The following chart shows nearly identical patterns currently emerging with multiple levels of EUR/USD support projected near EUR/USD parity within the next 12-24 months.
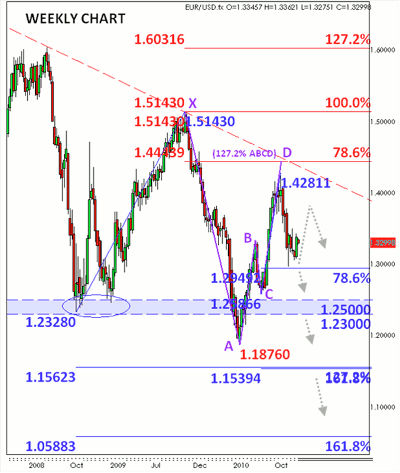
With a long-term bearish bias, the idea would be to look for selling opportunities that may come in the form of some bearish geometric patterns. Prices are currently coming down off bearish trend line resistance at C3 where we had a bearish Gartley pattern complete on the weekly chart:
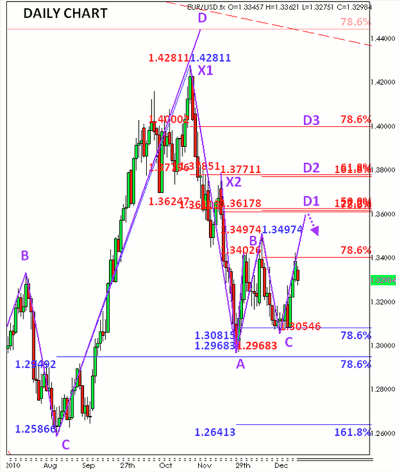
Prices have since fallen off to 78.6% support of this weekly CD leg, which may in turn point to a near-term rally. This would provide an ideal selling opportunity based on an emerging bearish Gartley pattern projected to complete on the daily chart below. Prices are currently testing 78.6% near-term resistance near 1.34, and if this level fails, there is a good chance prices will continue up to initial pattern completion at D1 near 1.3615, followed by D2 near 1.3780. Conversely, if current resistance near 1.34 holds and prices move below point A (1.2968), then a potentially strong continuation move down to 161.8% support near 1.2640 may be in progress.
NEXT: Will GBP/USD Stay Range Bound?
|pagebreak|Will GBP/USD Remain Range Bound?
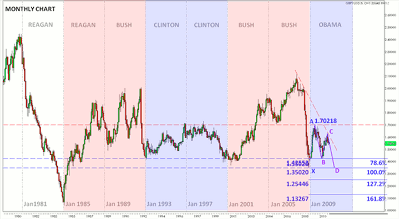
Although not having the specific geometric pattern repetition as seen on the EUR/USD, the cable does show some presidential administration correlation as well. The conservative Reagan/Bush administrations saw the GBP/USD climb to new highs before dropping sharply prior to the shift to new political party influence. During the Clinton years, the GBP/USD traded within an approximate range between 1.70-1.40, which has now come into play.
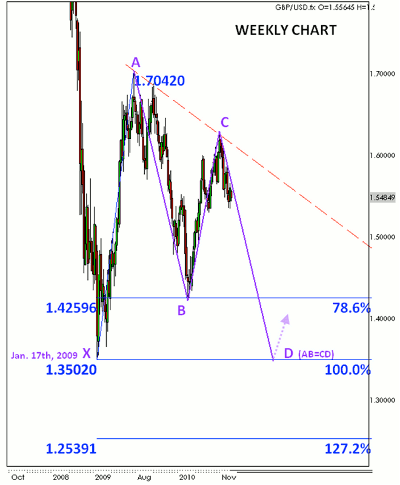
Prices are currently testing (potential) trend line resistance with room down to the bottom of that range. If the current top at point C near 1.63 holds, then we may see a double-bottom Gartley pattern complete near 1.35 within the next 12-24 months.
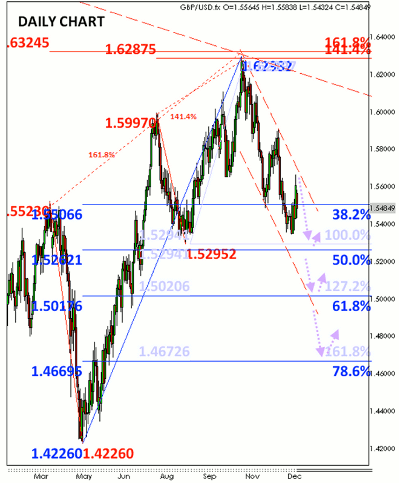
The GBP/USD will have to break through several levels of support as illustrated on the daily chart below. At the moment, bearish momentum remains intact.
NEXT: Will USD/JPY Rally or Break Major Support?
|pagebreak|USD/JPY Resting on Major Support
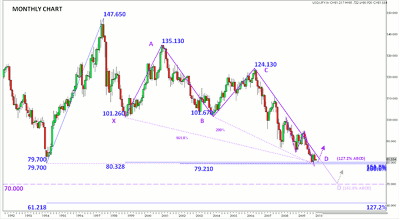
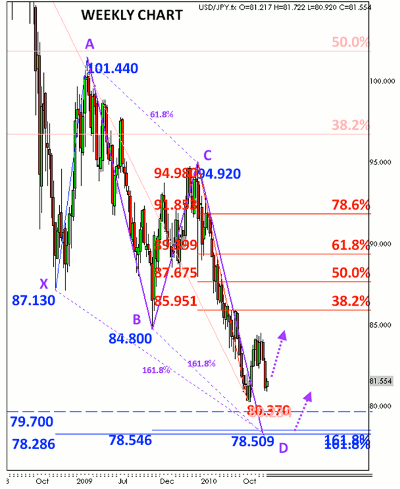
Currently, the USD/JPY sits atop major long-term support near 80.0. Aside from the all-time low of 79.70, additional support comes from the 161.8% XA and 200% BC extensions, as well as a 127.2% ABCD pattern, giving us a solid, recently completed bullish butterfly pattern, as the following monthly chart depicts:
The long-term pattern completion suggests a more significant bullish reversal moving forward with Fib resistance of the weekly CD leg to serve as targets to the upside. Note that although technically complete, there may still be a bit of room down to about 78.50 where a more recent, confirmatory pattern is projected to complete as shown on the weekly chart below:
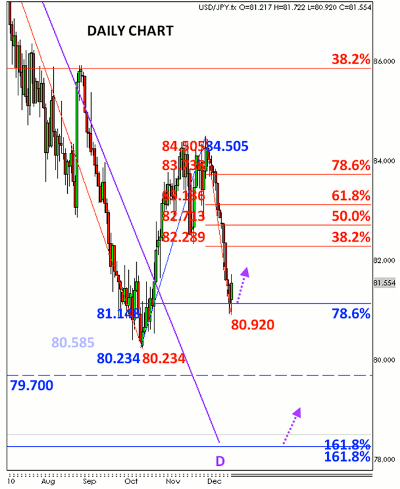
Again, the initial monthly pattern has completed, so a bottom may have already been established as prices have now pulled back, retesting pattern completion at 78.6% daily support near 81.0 (see daily chart below). A near-term rally to daily Fib resistance levels is likely if the current bottom at 80.92 holds. If not, then a drop down to secondary pattern completion near 78.50 becomes more likely.
NEXT: USD/CHF, USD/CAD Also Testing Critical Support
|pagebreak|USD/CHF Testing Critical Support
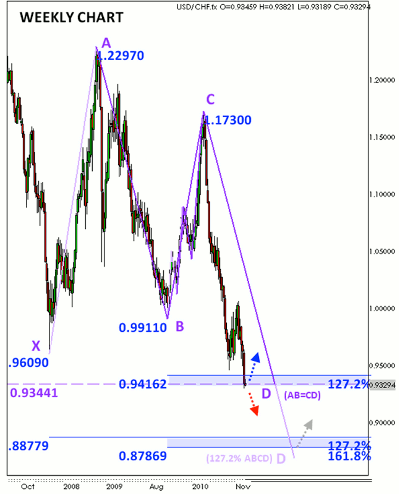
The USD/CHF is currently testing weekly AB=CD pattern support near .9300. Longer-term bias remains bearishly based on the recent, relatively shallow weekly retracement, along with the fact that we’re seeing fresh all-time lows.
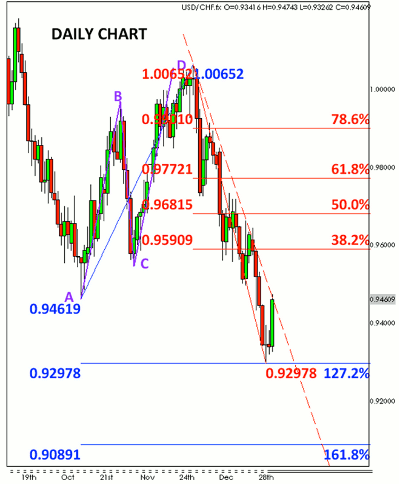
The key for a more significant near-term rally will be a daily close above daily trend line resistance (below), in which case a bullish continuation up to daily Fib resistance beginning with the 38.2% level near .9590 is more likely. However, if trend line resistance holds and current weekly AB=CD pattern support at .9300 fails, then a potentially strong bearish continuation down to 161.8% daily support near .9100 may be in progress (followed by weekly bullish butterfly pattern support near .8800).
USD/CAD Flirting with Significant Support
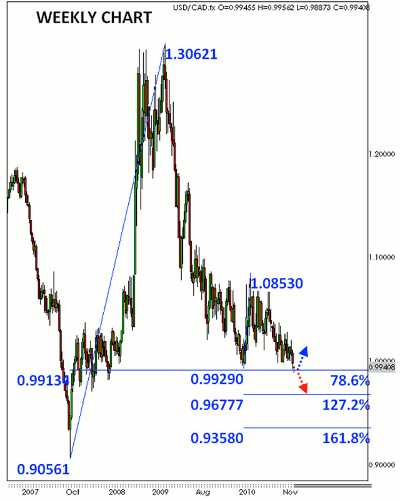
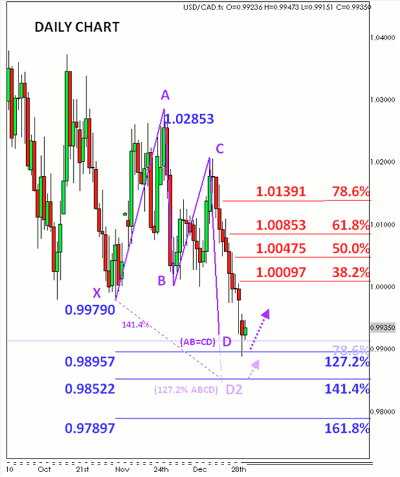
The USD/CAD recently gapped down to fresh two-year lows to start out 2010, having now hit daily bullish butterfly pattern completion near major 78.6% weekly support. The concern here is that a gap prior to pattern completion typically serves as a warning sign, as it suggests a continuation move may be in progress. In this case, since initial pattern completion at point D is defined by an AB=CD pattern, the gap increases the odds of a continuation down to the 127.2% ABCD extension where secondary pattern completion is projected to complete (at D2 near .9850--see daily chart below).
Keep in mind, however, that this particular gap occurred immediately prior to pattern completion, so a bullish daily candle at this point would result in a morning star candlestick formation, which would actually serve as a confirmation of current pattern completion. Retracements of CD (beginning with 38.2% near parity) would serve as conservative targets to the upside (these levels are based on current CD leg, and need to be adjusted if prices instead drop down to secondary pattern completion). Also keep in mind that new lows at this point confirm the longer-term bearish outlook with room down to weekly support near .9677, followed by .9358, so any countertrend buyers may want to look for relatively conservative targets (i.e. secondary bullish butterfly pattern completion at D2).
NEXT: Can Aussie, Kiwi Continue to Rally?
|pagebreak|AUD/USD Rally Remains Intact
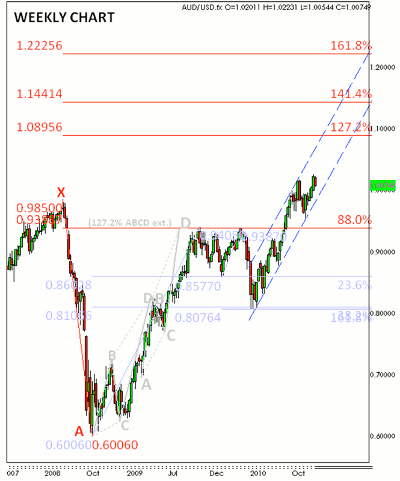
The aussie has rallied aggressively since bottoming out at .6060 towards the end of 2008 and has now reached new all-time highs against the greenback while holding onto trend line support throughout 2010. Longer-term signs still point north as current bull channel has seen consecutive 50% retracements before having climbed to new highs. These shallow retracements preceding new highs/lows may be interpreted as signs of a more strongly trending market and leave room up to Fibonacci extension resistance near 1.0360, 1.0580, and 1.09.
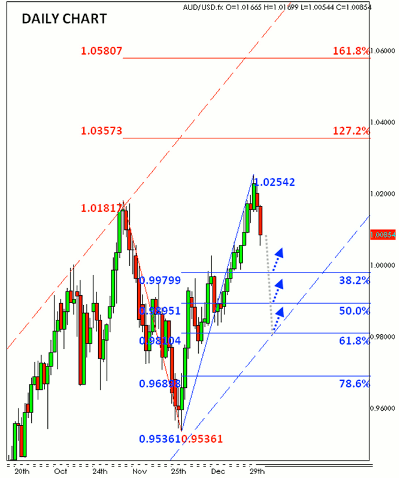
Of course, a longer-term bullish outlook means we’ll keep an eye out for buying opportunities, which typically come in the form of pullbacks, especially near trend line/Fib support as shown on the daily chart below. Ideally, we’d like to see a medium-term bullish pattern emerge and complete near one of these daily support levels (beginning with 38.2% support near .9980). This allows for a trader to not just anticipate entry, but more importantly, determine exits in advance. This allows for time to determine risk/reward, risk tolerance, and ultimately, the appropriate position size.
Will NZD/USD Reach New All-Time Highs in 2011?
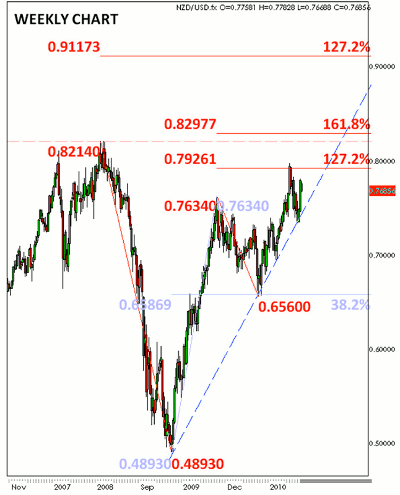
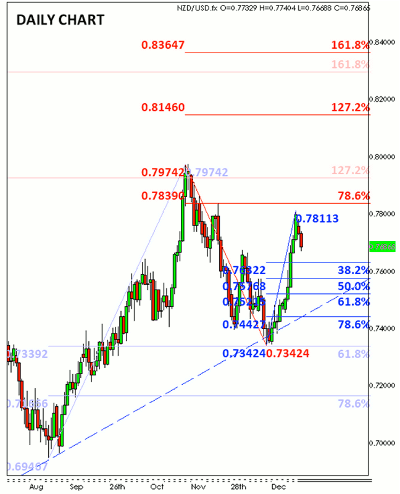
Good question. At the moment, it’s rather difficult to determine a longer-term technical bias. True, the kiwi has been in a strong uptrend versus the dollar, but it still must contend with previously established resistance near .8200 (current all-time high). A daily close above .80 should be enough to send the NZD/USD up to key resistance near .8150-.8200, followed by .8350-.8400.
In the near-term, there may be some room down to daily fib/trend line support illustrated on the daily chart below, as prices are currently testing 78.6% daily resistance near .7840. A daily close below trend line support would be indicative of a more substantial pullback down to Fib support of the swing leading into the current .7975 top, which comes in around .7170-.7100.
By Roger Stojsic, technical analyst, GFTForex.com

