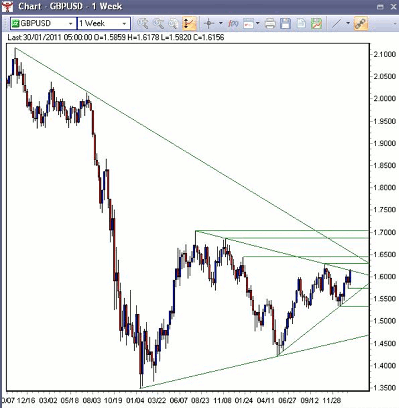
The GBP/USD appears set to end its five-month period of sideways trading as the pair is currently testing the upper boundary of a consolidation pattern.
A surprisingly strong January has helped cable come off of its December lows and the pair is now testing a trend line that falls off of the August 2009 high. The trend line comes in this week at 1.6160.
Should the GBP/USD breach this trend line, the path higher is littered with resistance levels. The first target would be the October 2010 high at 1.6300, followed by the January 2010 high at 1.6460. This price level should have added significance as it coincides with the falling trend line of the 2007 high. Further resistance is found at the November 2009 high of 1.6880, followed by the August 2009 high of 1.7040.
If the long-term trend line holds and the GBP/USD moves lower, support is located at the previous week’s low of 1.5750, followed by the rising trend line off of the May lows, which comes in this week at 1.5520. Further support may be found at the December 2010 low of 1.5340.
While it may not be relevant at this time, a distinct head-and-shoulders pattern is identifiable with the neckline below the September and December lows of 2010. A move above the 1.6300 level would nullify this reversal pattern.
By the Staff at ForexYard.com


