See how using Fibonacci levels on the charts can not only provide high-probability trade entries, but can also allow the trader to pinpoint profit targets with a good risk/reward ratio every time.
Today, I would like to take a look at the possibility that you missed a terrific entry on a trade, but you are still confident in the eventual destination. How far are you willing to "chase" that trade?
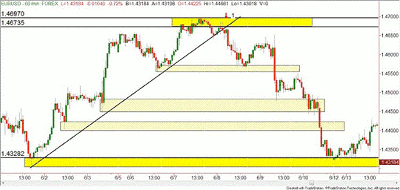
Looking at the following chart, we have several possible entries for a short EUR/USD trade. The first red arrow labeled "1" would have been the best entry, as we have a trend line break and a re-test of a supply zone in the 1.4673 range. We also have a very healthy profit target near the 1.4328 range, giving us a reward/risk ratio of about 10:1 (approx. 345-pip target with an approx. 30-pip stop).
While it is easy to see a 10:1 reward-to-risk ratio when looking at a chart from the past, looking at a chart live is a different beast altogether!
It is realistic to assume you may have had much smaller profit targets while watching the live charts. As we can see, these minor demand zones (marked with the cross-hatched yellow zones) were only speed bumps along the way to our eventual 1.4328 range.
So let's assume you analyzed the chart and believed that eventually, we would see this bottom target; how many more chances would you have had to enter a short trade?
The general Online Trading Academy reward-to-risk rule is to only take trades that offer you a potential 3:1 ratio.
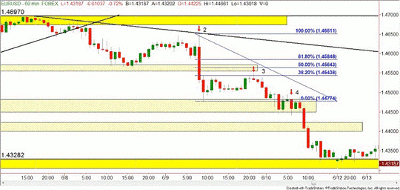
The chart above is merely a close-up of the previous chart, with a couple of trend-following trade entries indicated. The red arrow marked "2" would have been a potential short trade using a trend line trading technique. This would have been the third or maybe the fourth touch of the trend line to prove its validity.
While not indicated on this chart, the high of that candle also was re-testing another supply zone, plus it was giving us a possible right shoulder on our head-and-shoulders reversal pattern. The head-and-shoulders pattern is easier to see on the first chart.
So what was the reward-to-risk ratio here? Selling at the 1.4650 level with the same 1.4328 target would have given us a reward of approx. 325 pips and a risk of approx. 50 pips for a near 6:1 ratio. Still pretty good!
At the red arrow labeled "3," there was a Fibonacci retracement of about 38% which gave us another entry on the short side. (My basic rules on Fibonacci are these: 1) Larger time frames are possible supply and demand zones; 2) Smaller time frames are good for trend-following trades. There are dozens of Fibonacci techniques, but that is how I use them. To hear all of my Fibonacci rules, see you in class!)
So selling around the 1.4543 Fib level still gives us a reward down to the 1.4328 target, but where does the stop go? Way up above the 1.4697? That works out to be a 220-pip reward and a 150-pip stop. Not quite what I had in mind!
So now it begs the question of where should my stop go for my minimum 3:1 reward-to-risk ratio? In this example, my stop would go above the cross-hatched yellow demand/supply zone at approximately 1.4580, which then improves my risk to only 45 pips or so. Now, 220-pip reward and a 45-pip risk is 5:1, and that works for me!
Last but not least is the arrow marked "4." For clarity on the chart, I did not mark the trend line that exists from the #2 arrow that intersects this entry (third touch again), nor did I mark that this is another Fibonacci trend trade. Go back on your charts and mark them; they are there! If you use neither of those trend-following techniques, this is also a classic example of a breakdown and retest of the 1.4474 level.
So again, is this a quality trade that we can take, using the 1.4328 as our target? The reward works out to be around 150 pips, but what is our risk?
Obviously, again, our stop can't be above the 1.4697 level. Placing our stop above the previous swing high (red arrow marked 3) gives a stop of nearly 75 pips. Many short-term/intraday traders will take a 2:1 reward-to-risk ratio, so this would be acceptable to them. Built into this 60-minute chart is a smaller, less obvious swing high at approximately 1.4500. This would give a stop of about 30 pips for a ratio of 5:1.
So what is the big takeaway from all of this? Properly identified major supply and demand zones will give the best reward-to-risk-ratio trades…obviously! The only problem is the proper identification of these zones.
At the time, we aren't sure how far this trade will run. By identifying the major versus minor supply and demand zones, we can join the trend by entering near the minor zones, taking us to the major zones. Make sure your stop is adjusted to what is potentially "left" in the trade to keep your ratio in line with proper risk management!
By Rick Wright, instructor, Online Trading Academy


