
These textbook chart patterns prove that EUR/USD traders who applied Elliott Wave analysis got clear, consistent trading signals and could ignore ever-changing and often conflicting news headlines.
I was recently talking with an Elliott Wave trader about how today, the euro weakness/dollar strength we saw in the second half of 2011 doesn’t surprise anyone.
See related: Elliott Wave Called the Euro Collapse
Traders who use Elliott Wave were also able to stick with a dollar-bullish forecast for most of that dollar move and profit from it along the way.
But let’s dive into some details. What was it about the Elliott Wave structure of EUR/USD (the euro-dollar exchange rate and world’s most actively traded forex pair) that told our analysts to expect EUR/USD to fall?
Let’s look at a sample of actual analysis. Here’s the EUR/USD forecast based on Elliott Wave readings from November 21, 2011. At that time, EURUSD was trading near $1.3500—some 900 pips higher than where it traded a few days ago:
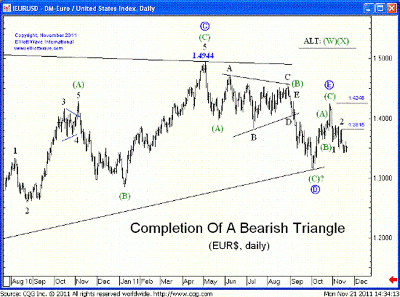
Click to Enlarge
Most experts in Elliott Wave looked at the EUR/USD and concluded the pair was headed lower. What did they see?
You can see two sets of converging trend lines in this daily EUR/USD chart. The larger one is labeled C, D, E (circled), and the smaller one says "ABCDE."
Both of these Elliott Wave structures are contracting triangles. Those are sideways, overlapping moves that consist of five internal legs (or waves) labeled A, B, C, D and E. The larger contracting triangle is so large that you only see the last three labels, C, D, E (circled). The smaller triangle is fully visible.
Now, what does a triangle mean when you see one on a chart? Here’s how Frost & Prechter’s classic book on Elliott Wave analysis explains it:
“Triangles appear to reflect a balance of forces, causing a sideways movement that is usually associated with decreasing volume and volatility. Triangles contain five overlapping waves that subdivide 3-3-3-3-3 and are labeled a-b-c-d-e. …when a triangle occurs in the fourth wave position, wave five is sometimes swift and travels approximately the distance of the widest part of the triangle.”
Elliott used the word "thrust" in referring to this swift, short motive wave following a triangle.
That’s why the EUR/USD chart above is labeled "Completion of a Bearish Triangle." Triangles are sideways moves, and that explains why EUR/USD spent the entire last summer making zero net progress (that’s that second, smaller set of converging trend lines).
Finally, as the quote above says, triangles are followed by a "thrust" after the "balance of forces" is finally toppled over.
So there you have it. While the world this past summer was focusing on the US debt downgrade by Standard & Poor’s and the "European contagion" and trying to decide which factor would impact the dollar and the euro the most, Elliott Wave analysis was sending one clear message: dollar strength, euro weakness ahead.
Forex traders who understand Elliott Wave have a marked advantage over traders who follow just news events and interest rates. Start counting waves now, and within a few weeks, you’ll be able to make better trading decisions based on sound technical analysis.
See related: Merits of Elliott Wave Analysis
By Vadim Pokhlebkin of ElliottWave.com
Begin your Elliott Wave education by downloading a free E-book.


